- Ebooks & Courses
- Practice Tests

How To Write an IELTS Line Graph Essay
Here is the 5 steps process I recommend for planning and writing IELTS line graph essays:
1) Analyse the question
2) Identify the main features
3) Write an introduction
4) Write an overview
5) Write the details paragraphs
I’m going to take you through the whole process step-by-step as we work on a practice question.
Many students are reluctant to spend time on steps 1 and 2 as they want to spend as much of the 20 minutes allowed for the essay as possible actually writing it. However, it is essential that you do them as they are the key to writing a high-scoring IELTS line graph essay.
Before we begin, here’s a model essay structure that you can use as a guideline for all IELTS Academic Task 1 questions.
Ideally, your essay should have 4 paragraphs:
Paragraph 1 – Introduction
Paragraph 2 – Overview
Paragraph 3 – 1 st main feature
Paragraph 4 – 2 nd main feature
Now that we have all these tools we need, we’re ready to begin planning and writing our IELTS line graph essay.
Here’s our practice question:
The graph below shows radio and television audiences throughout the day in 1992.
Summarise the information by selecting and reporting the main features, and make comparisons where relevant.
Write at least 150 words.

Source: Official IELTS website
Step 1 – Analyse the question
The format of every Academic Task 1 question is the same. Here is our practice question again with the words that will be included in all questions highlighted .
The graph below shows radio and television audiences throughout the day in 1992.
Every question consists of:
- Sentence 1 – A brief description of the graphic
- Sentence 2 – The instructions
- The graphic – chart, graph, table, etc.
Sentence 2 tells you what you have to do.
You must do 3 things:
1. Select the main features.
2. Write about the main features.
3. Compare the main features.
All three tasks refer to the ‘ main features ’ of the graphic. You do not have to write about everything. Just pick out 2 or 3 key features and you’ll have plenty to write about.
Step 2 – Identify the Main Features
The graphic in IELTS line graph questions should not be difficult to interpret. Each question has been created to test your language skills, not your mathematics ability.
All you are looking for are the main features. These will usually be the easiest things to spot. There will be lots of information in the graphic to help you identify them.
Here are some useful questions to ask?
- What information do the 2 axes give?
- What are the units of measurements?
- What are the time periods?
- What can you learn from the title and any labels?
- What is the most obvious trend?
- Are there any notable similarities?
(I give more detail on how to use these questions, plus downloadable checklists for identifying the main features of all 7 different types of IELTS Academic Writing Task 1 questions, in the lesson on How To Understand & Analyse Task 1 Questions .)
So, what main features stand out in our practice graphic?
Here's our IELTS line graph again.
The timeline will give you the biggest clues as to the most significant trends. Look for general trends.
There are 2 main features/trends in this line graph:
Main feature 1: The peak time for TV audiences is in the evening (8 pm).
Main feature 2: The peak time for radio audiences is in the morning (8 am).
The general trends you select will be the starting point for your essay. You will then go on to add more detail. However, with just 20 minutes allowed for Task 1, and a requirement of only 150 words, you won't be able to include many details.
We’re now ready to begin writing our essay. Here’s a reminder of the 4 part structure we’re going to use.
Step 3 – Write an Introduction
In the introduction, you should simply paraphrase the question, that is, say the same thing in a different way. You can do this by using synonyms and changing the sentence structure. For example:
Introduction (Paragraph 1):
The line graph illustrates the proportion of people in the UK who watched TV and listened to the radio over 24 hours from October to December 1992.
This is all you need to do for the introduction.
Step 4 – Write an Overview (Paragraph 2)
In the second paragraph, you should report the main features you can see in the graph, giving only general information. The detail comes later in the essay. You should also make any clear comparisons you spot.
This is where we write about the general trends. Here are the ones we picked out above.
Now form these ideas into two or three sentences with a total of around 40 words. State the information simply using synonyms where possible. No elaborate vocabulary or grammar structures are required, just the appropriate words and correct verb tenses.
For example:
Overview (Paragraph 2):
Overall, a significantly greater percentage of the TV audience watched in the evening while radio had the most listeners in the morning. Over the course of each day and night, more people watched TV than listened to the radio.
Step 5 – Write the 1st Detail Paragraph
Paragraphs 3 and 4 of your IELTS line graph essay are where you include more detailed information about the data in the graphic. In paragraph 3, you should give evidence to support your first key feature. Don’t forget to make comparisons when relevant.
Here is our first main feature again:
And this is an example of what you could write:
Paragraph 3 :
Less than 10% of people watched TV between 1 am and 12 noon but at 4 pm this figure increased rapidly, reaching a peak of almost half the population at 8 pm. After this, the graph records a sharp decline in viewers, reaching a low of only a tiny percentage by 3 am.
Step 6 – Write the 2nd Detail Paragraph
For the fourth and final paragraph, you do the same thing for your second key feature.
Here’s an example of what you could write:
Paragraph 4 :
Radio, on the other hand, shows a very different trend. The most popular time for listeners to be tuned in was just after 8 am when around 27% of the population was listening. After a brief peak, the numbers dropped steadily to barely 2%, apart from fluctuations at around 4 pm and 10.30 pm. The percentage of listeners remained low overnight before beginning a rapid ascent from 6 am to the 8 am high.
Here are the four paragraphs brought together to create our finished essay.
Finished IELTS Line Graph Essay

This sample IELTS line graph essay is well over the minimum word limit so you can see that you don’t have space to include very much detail at all. That’s why it is essential to select just a couple of main features to write about.
Now use what you’ve learnt in this lesson to practice answering other IELTS line graph questions. Start slowly at first and keep practicing until you can plan and write a complete essay in around 20 minutes.
Want to watch and listen to this lesson?
Click on this video.
Would you prefer to share this page with others by linking to it?
- Click on the HTML link code below.
- Copy and paste it, adding a note of your own, into your blog, a Web page, forums, a blog comment, your Facebook account, or anywhere that someone would find this page valuable.
Like this page?
Ielts academic writing task 1 – all lessons.
IELTS Academic Writing – A summary of the test including important facts, test format & assessment.
Academic Writing Task 1 – The format, the 7 question types & sample questions, assessment & marking criteria. All the key information you need to know.
Understanding Task 1 Questions – How to quickly and easily analyse and understand IELTS Writing Task 2 questions.
How To Plan a Task 1 Essay – Discover 3 reasons why you must plan, the 4 simple steps of essay planning and learn a simple 4 part essay structure.
Vocabulary for Task 1 Essays – Learn key vocabulary for a high-scoring essay. Word lists & a downloadable PDF.
Grammar for Task 1 Essays – Essential grammar for Task 1 Academic essays including, verb tenses, key sentence structures, articles & prepositions.
The 7 Question Types:
Click the links below for a step-by-step lesson on each type of Task 1 question.
- Table Chart
- Process Diagram
- Multiple Graphs
- IELTS Writing
- IELTS Line Graph
- Back To Top
* New * Grammar For IELTS Ebooks

$9.99 each Full Set Just $ 23.97
Find Out More >>
IELTS Courses

Full details...

IELTS Writing Ebook

Discount Offer
$7 each Full Set Just $ 21

Find out more >>
Testimonials
“I am very excited to have found such fabulous and detailed content. I commend your good work.” Jose M.
“Thanks for the amazing videos. These are ‘to the point’, short videos, beautifully explained with practical examples." Adari J.
"Hi Jacky, I bought a listening book from you this morning. You know what? I’m 100% satisfied. It’s super helpful. If I’d had the chance to read this book 7 years ago, my job would be very different now." Loi H.
"Hi Jacky, I recently got my IELTS results and I was pleased to discover that I got an 8.5 score. I'm firmly convinced your website and your videos played a strategic role in my preparation. I was able to improve my writing skills thanks to the effective method you provide. I also only relied on your tips regarding the reading section and I was able to get a 9! Thank you very much." Giano
“After listening to your videos, I knew I had to ditch every other IELTS tutor I'd been listening to. Your explanations are clear and easy to understand. Anyways, I took the test a few weeks ago and my result came back: Speaking 7, listening 9, Reading 8.5 and Writing 7 with an average band score of 8. Thanks, IELTS Jacky." Laide Z.
Contact
About Me
Site Map
Privacy Policy
Disclaimer
IELTS changes lives.
Let's work together so it changes yours too.
Copyright © 2024 IELT Jacky
All Right Reserved
IELTS is a registered trademark of the University of Cambridge, the British Council, and IDP Education Australia. This site and its owners are not affiliated, approved or endorsed by the University of Cambridge ESOL, the British Council, and IDP Education Australia.
A summary of a line graph

Learn how to describe a line graph.
Do the preparation task first. Then read the text and tips and do the exercises.
Preparation
Matching_MjMxNjU=
The graph below shows how people buy music. Summarise the information by selecting and reporting the main features, and make comparisons where relevant.

Overall, both downloads and physical sales of music have steadily declined. The latter has slumped since 2011, while the downturn for the former began in 2014. However, there has been a sharp rise in people streaming music since 2013.
In 2011, the majority of music sales were of CDs, at 55% of all sales. In contrast, streaming was not common at all at only 5%. Also, although people had started to download music, it only represented 35% of sales. As sales of CDs began to fall, downloads started to rise. They rose steadily and downloads overtook physical sales in mid-2013. During the same period, streaming doubled to 10% but then it started to grow more dramatically.
Downloads peaked in 2014 at about 43% of sales but fell to 30% by 2018. This was slightly higher than physical sales, which shrank to 25%. Streaming, on the other hand, overtook both of them and accounted for just over 40% of sales in 2018.
Please note: This page was designed for writing practice only. Information in the graph may not be accurate.
- Change the words in the question to introduce your answer, e.g. This graph shows = This graph illustrates .
- The second paragraph should give an overview of the main points the graph shows (imagine you're describing the results to someone who can't see the graph).
- The following paragraphs should describe the main patterns or trends in more detail.
- Use precise vocabulary like steadily declined and a sharp increase to describe trends. Use linking expressions like while and in contrast to make comparisons.
- The question asks you only to 'Summarise the information'. Don't give reasons why these trends might have occurred, or your personal preferences on the topic.
TrueOrFalse_MjMxNjY=.xml
ReorderingHorizontal_MjMxNjc=.xml
GapFillDragAndDrop_MjMxNjk=.xml
What are the trends in the way you have been buying and listening to music over the last five to ten years?
Language level
This graphical representation depicts or illustrates the revenue generation status of three major activities which are relevant to music industry namely Streams, Downloads and CD purchases. The graph is plotted with respect to the percentage of above across the range of years from 2011 till 2018. Detailed analysis of the statistics clearly indicate that the financial outcome obtained from CDs was highest during the year 2011 contributing about 50 to 60 percent of the revenue. However, the same has declined gradually over a period of time. On the contrary, the sales pattern of Streams depicts a consistent rise eventually leading to favorable profit margin. Both of these items have experienced significant variations. As compared with above two, the cost returns from Downloads seems to be having potential variations with frequent rise and fall. It has produced a peak of profit margin somewhere in the year 2014. However, it has failed to maintain its stability in span of years. The above study indicates a comparison of concrete statistical data in terms of music as an entertainment sector in the range of years.
- Log in or register to post comments
I would like to take advantage of my age and go deeper back into the past until the eighties when I started to listen to music using cassettes we recorded from the radio! The quality was very bad but we liked it anyway, spending hours listening to songs interrupted by the voice of the radio's announcer or the surrounding noises of our home. In the nineties the CD appeared with its incredible high quality of sound. I spent a lot of money buying CDs because I thought they would last for a lifetime. But 20 years later all changed with the music streaming and I no longer use my almost 500 CDs that are now only a nice memory of my youth.
As far as I remember I have been always fond of music. In any period of my life, I was attracted to a specific style of music based on my mental and emotional condition. Sometimes wordless, epic, happy, dance, meditation, and relaxing music. Listening to music has become one of my personality habits, so to speak. In fact, I think the music listening trend has been a constant line for me and only the styles have changed.
I usually listen to audio files, when I'm coding, taking a walk, meditating, controlling my anger, cleaning my room, in the bathroom, subway, in noisy places, and so on.
Of course, because my sense of hearing is strong and I generally learn many things through listening. besides music, I listen to lots of educational audio files.
But as it turned out, especially in the last five years, I have gotten really interested in wordless, meditation, and relaxing music. This type of music makes my mind orderly and calm and increases its performance.
About buying music, I have always downloaded music for free though if I like one that is paid, I will definitely buy it.
Over the last five to ten years I have been listening and downloading music from various social media sites like spotifly tiktok or youtube.
When I was a teenager, I would love to listen to the radio. During that time, FM radio, which aired trendy songs, were popular. Moreover, I did buy some copied CD from the illegal seller and listened to those English Songs. Unfortunately, I have to admit that I did not have much knowledge about copyrights and much thinking about how much effort that the artists had to put for their art pieces. Nowadays, I mostly stream on Spotify and YouTube for my favourite songs.
The Hallyu Wave of K-Pop obviously, started in 2016. For the past six years, I was listening to korean music, from alt/indie to k-pop and from r&b to ballad. But, if I may take the times to years before that, I was just listening to some mainstream pop and r&b, sang by famous pop stars. On the other hand, for the last 2-3 years, I have been listening to many artists from various genres. I like how quite diverse it turns my playlist to and I will probably keep up this trend for a while.
Through the years, all I do to find out music is watching YouTube. Recently I start watching rhythm gamers, and I found many good songs that I never heard of (started using internet since 2016 so yea), like Fallen Symphony or At the Speed of Light.
I used to listen to music on a casette player, I remeber I would play my favorite song again and again, Nowadays due to the advancement of technology listening to music becomes more convenient and accessible.
Over the last five to seven years I have been listening and downloading music from various social media sites.
The trend in the world I'm seeing that future is all about streaming. I listen music on streaming not download and buying CD. In the future trends of streaming is dramatically rise.
Online courses

Group and one-to-one classes with expert teachers.

Learn English in your own time, at your own pace.

One-to-one sessions focused on a personal plan.

Get the score you need with private and group classes.
Welcome Guest!
- IELTS Listening
- IELTS Reading
- IELTS Writing
- IELTS Writing Task 1
- IELTS Writing Task 2
- IELTS Speaking
- IELTS Speaking Part 1
- IELTS Speaking Part 2
- IELTS Speaking Part 3
- IELTS Practice Tests
- IELTS Listening Practice Tests
- IELTS Reading Practice Tests
- IELTS Writing Practice Tests
- IELTS Speaking Practice Tests
- All Courses
- IELTS Online Classes
- OET Online Classes
- PTE Online Classes
- CELPIP Online Classes
- Free Live Classes
- Australia PR
- Germany Job Seeker Visa
- Austria Job Seeker Visa
- Sweden Job Seeker Visa
- Study Abroad
- Student Testimonials
- Our Trainers
- IELTS Webinar
- Immigration Webinar
IELTS Writing Task 1 – Line Graph

Updated On Jan 25, 2024
Share on Whatsapp
Share on Email
Share on Linkedin

IELTS Writing Prediction Questions for 2024
IELTS line graphs
In IELTS Writing task 1 of the academic section, there will be a visual representation or a diagram on which you have to write a paragraph. One of these visual representations may be pie charts.
Sometimes, in the IELTS examination , you are asked to explain a Line graph. The IELTS line graph shows how data changes over time. These line graphs will have 2 axes, one is X-axis and another is Y-axis.
The X-axis shows the time period and the Y-axis shows what is being measured. The line graph highlights the trends when the data goes up and down. You should take only 20 minutes to complete this task and it should be a 150-word essay.
Line graph – An example:

Types of Line Graphs:
There are three types of line graphs. They are:
- Simple line graph
- Multiline graph (or) Polyline graph
- Compound line graph
Simple Line Graph:
Definition: These types of graphs have just a single line plotted on them.

Sample Answer
The given image depicts a line graph representing the trend in the occurrence of X disease in Someland from 1960 to 1995.
The line graph represents the presence of X disease in Someland in varying numbers at different time intervals until it is wiped out entirely from the place.
It is clear from the line graph that the number of people affected by X disease did not cross 100 between 1960 -1965. The number of affected individuals began rising after the year 1965 and reached 200 in 1970 and 500 in 1975 respectively. The occurrence of X disease remained stagnant between 1975-1980 at 500 affected individuals. After the year 1980, the number of cases took a downward trend, falling down to almost 350 in 1985 before being completely eradicated by the year 1990. The number of people affected by X disease in Someland has been zero from 1990 till 1995.
Multiline graph (or) Polyline graph Task 1:
Definition: They are commonly used for comparison. These types of graphs have more than one line. ( on the same axis)
The graph portrays the consumption of three kinds of spread, namely, Margarine, Lowfat and reduced spreads and butter, over 26 years, from 1981 to 2007.
It is evident that butter and margarine were the primary spreads used until the introduction of low-fat and reduced spreads.
The staple spread from the early 1980s till the early 1990s was butter. The consumption of margarine followed a fluctuating trend over the years, from 1981 to 1986. The consumption decreased but then rose till 1991 and remained stagnant till 1996 after which it started declining. The use of low-fat and reduced spread began from 1996 and rose sharply from the first year till 2001 after which its preference decreased.
With regards to quantity, butter peaked at about 160 grams after which it followed a downward trend. The quantity of Margarine was within 80-100 grams for 20 years till 2001 after which it fell to 40 grams in 2007. The number of low-fat spreads crossed 80 grams in 2001 after which its consumption quantity fell.
Compound line graph:
Definition: It is an advanced version of the multi-line graph. The area between two lines is shaded indicating the size of that part.

The given graph shows the frequency of three different kinds of vehicles, which are, vans, trucks and tricycles on a road at different times of the day.
It is clear from the graph that at any point in time, the number of vans on the road are the highest among the three vehicles, followed by trucks and then tricycles. The peak hour of vans and trucks falls between 2-3 pm.
The number of vans on the road increases from 1-2 pm till 2-3 pm and then gradually decreases. The number of trucks on the road remains the same till 2-3 pm after which their number also starts declining. The number of tricycles is highest at 1-2 pm and then it follows a downward trend all throughout the day.
The road in question is dominated by vans for most of the day and trucks are also quite frequent during the afternoon. The number of tricycles are less as compared to the other two types of vehicles.
Tips for IELTS Writing Task 1 Line Graph 2022
- In the introduction part, you can paraphrase the question asked or the topic of the essay.
- When you explain the overall trend, identify the main feature and explain it.
- Ensure that each paragraph has examples that are percentages or numbers to support the sentence written as an explanation.
- You can look into the various lessons available on the line graph in order to answer the complex questions.
- The last tip is to practice as much as possible so that you get a good hold on what to write in the examination when questions become complex.
- You also need to use suitable verbs, nouns, adverbs, adjectives, prepositions related to time.
Writing the exam without practicing is a waste because you will not be able to understand anything in the exam. It may become complex and test-takers may skip the question which in turn will reduce your IELTS band score .
Here are the 10 examples for the IELTS Writing Line Graph Task 1 2022:
Also check :
IELTS Writing recent actual test
Frequently Asked Questions
What is a line graph?
Is there a dedicated vocabulary for line graph?
What is trend in a graph?
What is the structure used to describe a line graph?
Is conclusion required for writing task 1 – Line graph?
Practice IELTS Writing Task 1 based on report types

Effective IELTS Essay Connectors for Writing Task 2 & Task 1
Janet had been an IELTS Trainer before she dived into the field of Content Writing. During her days of being a Trainer, Janet had written essays and sample answers which got her students an 8+ band in the IELTS Test. Her contributions to our articles have been engaging and simple to help the students understand and grasp the information with ease. Janet, born and brought up in California, had no idea about the IELTS until she moved to study in Canada. Her peers leaned to her for help as her first language was English.
Explore other sample Line Graphs

Nehasri Ravishenbagam

Janice Thompson

Post your Comments

Khairul Alamgir
Posted on Sep 26, 2021
Its very nice your presentation.
Recent Articles

Raajdeep Saha

Kasturika Samanta

Our Offices
Gurgaon city scape, gurgaon bptp.
Step 1 of 3
Great going .
Get a free session from trainer
Have you taken test before?
Please select any option
Get free eBook to excel in test
Please enter Email ID
Get support from an Band 9 trainer
Please enter phone number
Already Registered?
Select a date
Please select a date
Select a time (IST Time Zone)
Please select a time
Mark Your Calendar: Free Session with Expert on
Which exam are you preparing?
Great Going!
Writing Strategies, Tips, and Samples for the IELTS Line Graph

Table of Contents
What is a line graph in ielts, use of line graph in ielts writing, structure of the ielts academic writing line graph, how to describe a line graph in ielts, strategies to score high in ielts academic line graph, tips to create ielts line graph, ielts line graph samples.
If you are preparing for the IELTS Writing test to study abroad, then you might have heard the term line graph . In the IELTS Academic Writing, understanding how to interpret and present data from various sources is crucial. One common form of data representation you may encounter is the line graph.
IELTS Task 1 Line graphs are used to illustrate trends, changes, and comparisons over a period. It is very important to learn about the Line Graph for IELTS Writing to get a good band score. However, many students are unaware of the Line Graph and its uses. But now you do not need to worry about it.
In this blog, we will explore everything about the IELTS line graphs and sample responses to help you ace this aspect of the exam.
A line graph, also known as a line chart, is a graphical representation of data over time. It consists of a series of data points connected by straight lines. Each data point represents a specific value, and the lines help visualise the progression or fluctuations in the data over a specified period.
Line bar graphs are a common type of visual data representation used in the IELTS Academic Writing Task 1. Test-takers are presented with a line graph that depicts information related to a specific trend, such as changes in temperature, population growth, or economic data. Your task is to analyse the graph and write a descriptive report based on the provided information.
The structure of your IELTS Task 1 line graph typically consists of the following components -
Introduction - Provide a brief overview of the graph's subject, including the timeframe and data sources.
Overview - Summarise the main trends or patterns evident in the line bar graph. Mention the highest and lowest points, significant increases or decreases, and noteworthy observations.
Details and Comparisons - Present specific data points from the graph. Use data accurately to support your observations, and make comparisons where relevant.
Conclusion - Provide a concise summary of the key findings without introducing new information.
Describing a line graph effectively in IELTS involves the following steps -
Identify Trends - Start by identifying the major trends or changes in the graph. Look for upward or downward slopes, plateaus, spikes, or significant patterns.
Use Data Points - Refer to specific data points on the graph to support your description. Also, mention exact numbers, percentages, or values when applicable.
Vary Your Vocabulary - Utilise a rich and varied vocabulary to describe the data. In addition, use adjectives and adverbs to add nuance to your descriptions. For example, instead of saying "a significant increase," you can say "a substantial rise."
Provide Context - Offer contextual information that helps the reader understand the significance of the data. This could include reasons for the trends or comparisons with other data sets.
To score high in the IELTS Academic Writing Line Graph task, consider the following strategies:
Before you start writing, take your time to thoroughly understand the graph and its key features.
Pay attention to the major trends and significant changes. Your overview should capture the essence of the graph.
Stick to the information presented in the graph; do not make assumptions or provide personal opinions.
Employ a variety of words and phrases to describe trends and changes. This showcases your language skills.
Don't repeat the exact phrases from the graph - paraphrase when possible to demonstrate your language versatility.
The IELTS Academic Writing Task 1 is time-bound. Allocate sufficient time to each section (introduction, overview, details, and conclusion) to ensure balanced coverage.
Here are some essential tips for creating a successful IELTS Line Graph response.
Familiarise yourself with various line bar graphs for IELTS by practising with sample questions. This practice will build your confidence and improve your analysis skills.
Expand your vocabulary related to data representation. Knowing synonyms for standard terms such as "rise," "fall," "peak," and "trough" can be very helpful.
IELTS Task 1 Line graphs can depict various data, including trends, comparisons, and combined information. Understand how to approach different types.
Carefully review your response for grammar and spelling errors because clear and error-free writing is essential.
If possible, have someone with strong English language skills review your practice responses and provide feedback.
Now, let's explore some IELTS Line Graph samples to see these strategies and tips in action.
IELTS Line Graph Question
The graph below gives information from a 2008 report about the consumption of energy in the USA since 1980 with projections until 2030. Summarise the information by selecting and reporting the main features and make comparisons where relevant. Write at least 150 words.

IELTS Line Graph Response
The aforementioned line graphs showcase data extracted from a 2008 report detailing energy consumption trends in the USA from 1980, extending to projected figures up to 2030.
As an overview, it can be stated that there has been a consistent increase in the consumption of fossil fuels from the initiation of the period. Projections indicate a further dependence on these fuel sources. Conversely, cleaner energy sources have accounted for significantly less consumption, and forecasts anticipate a continuation of this pattern.
Within the realm of fossil fuels, including coal, natural gas, petrol, and oil, their energy consumption has shown consistent growth since 1980. Commencing at 35 quadrillion units in 1980, petrol and oil experienced fluctuations until 2000. Subsequently, they exhibited a stable and consistent increase, with a projected consumption surpassing 45 quadrillion units by 2030. Likewise, coal demonstrated a similar upward trend, with estimates indicating it will surpass 30 quadrillion units by 2030. Natural gas usage is expected to plateau at approximately 24 quadrillion units from 2020 onwards.
Conversely, at the onset of the period, cleaner energy sources began with consumption levels below 5 quadrillion units and showcased a decrease in their usage, except for nuclear power, which saw a slight uptick to 6 quadrillion units in 2005. Predictions anticipate a modest increase in the use of solar/wind energy. Moreover, hydropower is foreseen to sustain relatively constant consumption levels until 2030."
Mastering the IELTS Task 1 Line Graph requires a combination of understanding data visualisation, vocabulary, and effective writing strategies. By practising regularly, improving your vocabulary, and adhering to the recommended structure, you can confidently tackle this part of the IELTS exam . Success in the IELTS Line Graph task boosts your Writing band score and enhances your ability to analyse and present data effectively.
We hope you are now aware of the Line Bar Graph and how to create it for writing tasks. However, you can contact Prepare IELTS (PI) expert counsellors for further guidance. Our team of education experts is dedicated to providing you with the best guidance in the IELTS exam. You can get a one-on-one counselling session online via our platform. Contact us at [email protected] or call us at +91 9773398388 .
No, IELTS may also include other types of visual data representation, such as bar charts, pie charts, and tables. It is essential to be prepared for a variety of data formats.
Your response should be at least 150 words. It is important to strike a balance between providing sufficient detail and adhering to the time limit.
It's better to use full sentences and paragraphs in your response. This format allows you to provide a structured and coherent explanation of the data. Bullet points or lists are generally not recommended.

Boost your IELTS Speaking score
Latest News

IELTS Speaking test - Most commonly garble words
2024-04-17 13:04:02

IELTS Score for New Zealand
2024-04-16 14:56:18

IELTS Score You Need for Admission in Europe
2024-04-13 12:34:11

Top Universities Accepting IELTS Scores
2024-04-12 15:54:24

IELTS Writing Vocabulary - Topic Wise Word List
2024-04-11 15:43:35

Describe a Time When You Needed to Use Your Imagination - IELTS Speaking Cue Card
2024-04-11 14:33:23

MBA Colleges Accepting IELTS Scores
2024-04-10 16:04:57

Describe a piece of good news - IELTS speaking cue card
2024-04-10 15:04:29

IELTS Exam Syllabus: Exam Format and More
2024-04-09 16:49:48
.jpg "line graph essay writing")
IELTS Writing Task 2: How to write a high-scoring IELTS Essay in 10 easy steps
2024-04-09 16:39:50

Related Blogs
A php error was encountered.
Severity: Notice
Message: Undefined variable: tips_category
Filename: Blog/blog_detail.php
Line Number: 383
File: /home/prepareieltsexam/public_html/application/views/frontend/Blog/blog_detail.php Line: 383 Function: _error_handler
File: /home/prepareieltsexam/public_html/application/controllers/Tips.php Line: 545 Function: view
File: /home/prepareieltsexam/public_html/index.php Line: 316 Function: require_once
Severity: Warning
Message: Invalid argument supplied for foreach()
IELTS Speaking test - Most commonly garble words Since Indian students are writing and speaking in English with Indian accent, with not much exposure to foreign accent, it can be the cause of
- (5.0 /152 votes)
IELTS Score for New Zealand Since Indian students are writing and speaking in English with Indian accent, with not much exposure to foreign accent, it can be the cause of
IELTS Score You Need for Admission in Europe Since Indian students are writing and speaking in English with Indian accent, with not much exposure to foreign accent, it can be the cause of
Top Universities Accepting IELTS Scores Since Indian students are writing and speaking in English with Indian accent, with not much exposure to foreign accent, it can be the cause of
Registration Now
Share Your Feedback
Free 1 day ielts class with our head of ielts program nick carey.
Register on the spot and get 10% Discount on IELTS fee!
Achieve IELTS Success with Our Comprehensive Classes, proven teaching methodology, and Experienced Teachers.
Affordable Fee Structure
Experienced & Certified Trainers
Interactive Class Activities
Friday, 2nd Feb 2024
11:00 AM - 4:00 PM
How To Write a Line Graph Essay: Step By Step Guide

- Post author By admin
- March 13, 2024
- No Comments on How To Write a Line Graph Essay: Step By Step Guide
Have you ever stared at a line graph in a textbook, wondering how to turn that squiggly line into a compelling essay? Fear not, fellow learners! This guide will equip you with the knowledge and skills to write a stellar line graph essay, even if you’re new to data analysis or academic writing. So, let’s start with a guide on how to write a line graph essay?
Table of Contents
Why Line Graphs Matter
Data surrounds us, from weather patterns to social media trends. Line graphs are a fantastic tool to visualize changes over time, making them crucial in various fields like science, economics, and even social media marketing. Understanding how to interpret and write about line graphs is a valuable skill for academic success and beyond.
How To Analyze the Graph?
Before putting pen to paper (or fingers to keyboard), take a close look at your line graph. It’s like deciphering a secret code! Here’s what you need to identify:
- The Big Picture: What’s the title? Does it give you a clue about the subject matter?
- Axes in Action: Identify the X-axis (horizontal) and Y-axis (vertical). What information do they represent? Are there units of measurement (e.g., years, dollars)?
- Labels for Clarity: Look for labels for each line on the graph. What do they represent? Are there any legends or keys explaining the lines?
- Time Traveler: What time frame does the graph cover? Is it a few months, years, or even decades?
- The Ups and Downs: This is where the magic happens! Analyze the trends. Does the line generally increase, decrease, or fluctuate? Are there any specific peaks or drops?
How To Write a Line Graph Essay?
Now that you’ve unlocked the secrets of the graph, let’s craft your essay.
Introduction: Setting the Scene (100-120 words)
- Hook: Start with a captivating sentence that grabs the reader’s attention. This could be a surprising fact related to the graph’s topic or a thought-provoking question.
- Keyword Introduction: Mention the importance of line graphs and how they help us understand data.
- Thesis Statement: Briefly state that you’ll be analyzing the line graph and explaining the trends you observe.
Did you know that smartphone usage has skyrocketed in the last decade? This essay will analyze a line graph depicting this trend, exploring the reasons behind the increase and its potential impact on society.
Overview Paragraph: The Big Picture (80-100 words)
- Briefly paraphrase the title of the graph and describe what it depicts.
- Highlight the main trends you observed – is there a steady increase, a sharp decline, or something else?
- Mention any interesting comparisons between the lines on the graph (if applicable).
The line graph titled “Global Smartphone Usage 2010-2020” reveals a significant rise in smartphone users over this decade. The data shows a steady upward trend, with a slight acceleration in recent years. Notably, the graph also shows a difference in the growth rates between developed and developing countries.
Body Paragraphs: Diving Deeper (300-400 words each)
This is where you showcase your detective skills and explain the trends you identified. Here’s what to focus on in each body paragraph:
- Pick a Specific Trend: Choose a key trend you observed in the graph (e.g., a constant increase, a sudden drop).
- Support Your Claims: Use evidence from the graph! Mention specific years, numbers, or percentages to illustrate your points.
- Explain Why: Don’t just describe, explain! What factors might be contributing to the trend? Consider possible causes related to the topic of the graph.
One significant trend is the steady rise in smartphone users globally. According to the graph, the number of users doubled between 2010 and 2020, from 1 billion to 2 billion. This growth can be attributed to several factors, including the increasing affordability of smartphones, the development of user-friendly apps, and the expansion of internet access in many regions.
Conclusion: Wrapping it Up (80-100 words)
- You can optionally add a final thought or prediction about the future based on the graph’s data.
In conclusion, the line graph clearly demonstrates the explosive growth in smartphone usage over the past decade. This trend is likely to continue as technology advances and internet access becomes more widespread. Understanding these changes is crucial for businesses, educators, and policymakers to adapt and shape the future of technology and its impact on society.
Key Points To Enhance Reader Experience
- Visuals: Consider including an image of the line graph you’re analyzing (with proper attribution if necessary). Annotating specific trends on the image can further enhance understanding.
- Real-world Examples: Where relevant, connect the data in the line graph to real-world examples to add context and make your essay more relatable.
Common Mistakes to Avoid: How To Write a Line Graph Essay
- Just Describing, Not Explaining: Don’t simply describe the trends in the graph. Analyze them and explain why they might be happening.
- Ignoring the Title and Labels: The title, axes labels, and any legends are crucial for interpreting the data. Make sure you use the information they provide in your essay.
- Making Up Data: Don’t invent information or draw conclusions that aren’t supported by the graph. Stick to the facts!
Bonus Tips: How To Write a Line Graph Essay
- Transition Words for a Smooth Flow: Transition words like “however,” “furthermore,” and “in addition” will help connect your ideas and create a logical flow in your essay.
- Vary Your Sentence Structure: Don’t be afraid to mix up short and long sentences to keep your writing engaging.
- Proofread and Edit: Once you’ve finished writing, take the time to proofread your essay for any grammatical errors or typos. Double-check that your data and interpretations align with the graph.
Additional Tips for Advanced Line Graph Essay Writing
- Compare and Contrast: If your line graph has multiple lines, delve deeper into the comparisons between them. Analyze how they rise, fall, or interact with each other.
- Consider External Factors: Are there any external events or developments that might explain the trends in the graph? Think outside the box and explore these connections.
- Acknowledge Limitations: No data source is perfect. Briefly mention any limitations of the data presented in the graph, such as the timeframe or sample size.
By following these steps and incorporating these tips for How To Write a Line Graph Essay, you’ll be well on your way to writing compelling line graph essays that demonstrate your analytical and communication skills.
Remember, practice makes perfect! The more you analyze line graphs and write about them, the more confident you’ll become. So grab your data, get ready to explore trends, and write those essays like a pro!
Leave a Reply Cancel reply
You must be logged in to post a comment.
- australia (2)
- duolingo (13)
- Education (266)
- General (71)
- How To (16)
- IELTS (127)
- Latest Updates (162)
- Malta Visa (6)
- Permanent residency (1)
- Programming (31)
- Scholarship (1)
- Sponsored (4)
- Study Abroad (187)
- Technology (12)
- work permit (8)
Recent Posts

Tips for IELTS Success

IELTS Writing Task 1 Line Graph: Types, Techniques and Sample Answers
IELTS writing task 1 line graphs are added in the test of IELTS writing task 1 academic to evaluate the understanding skills of a candidate. In this type of question, a graph is given by covering data with X axis and Y axis. You have to describe the information given in the line graph in 150 words minimum. You have to solve such task in 20 minutes.
Line graph types, procedure to write in line graph, strategies and skills required for line graph question type, sample answers, sample questions and tips are given below to make you familiar about IELTS academic writing task 1 line graph.
Line graph and its types
Line graph is also called a line chart in which you have to face a graph covering the data given in the graph represented by lines. There are two axis- X – axis and Y – axis. X – axis (horizontal) shows the time period while Y – axis (vertical) represents measurements. Line graphs represent the trends when data goes downward and upward.
There are three types of line graphs:
- Simple line graph:
This type of graph has one line plotted.
- Multiline graph or polyline graph
In these types of graphs, more than one lines are plotted. These graphs are mostly used for comparison between data.
- Compound line graph
It is different type of graph, the area between two lines is shaded, representing the filled area.
Different types of visual aids are there in IELTS writing task 1 academic. IELTS line graph is also one of the question types in IELTS writing task 1 academic. In line graph of IELTS writing task 1, you have to face a line graph containing information changing from one aspect to other. You have to solve this question type of IELTS writing to describe the data given in the test.
There are three different types of line graph – Simple line graph, multiline graph or compound graph, you can face in the test to solve. IELTS writing assessment criteria is important to learn for understanding marking criteria of writing test. A procedure to answer in IELTS line graph is broadly described in the article. Skills are necessary to solve this type of task. There is dedicated vocabulary for line graph of IELTS writing. Cohesive devices help to make your answer effective. Sample answers of IELTS writing task 1 familiarize you, how to answer in IELTS line graph questions. Question samples help you to practice in a better way.
Common errors regarding line graphs and tips for IELTS writing task 1-line graphs are essential to help you in line graph as well as for IELTS writing.
Procedure to write a line graph essay
A procedure to write an answer in line graph essay, first of all, you need to understand the graph and its trends. Note all key features and ups and downs very well. Write main trends in overview. The structure for IELTS writing task 1 line graph is simple as the introduction, overview, body paragraph 1 and body paragraph 2. In the body paragraphs, you have to add main features of the line graph.
There are five steps to answer in IELTS line graph:
- First of all, understand the line graph.
- Find out all main features and comparisons if valid.
- Introduce the task in which you have to paraphrase the question normally.
- Write overview in which you have to write the trends of the line graph.
- Writing the paragraphs in detail means to write all main features, key information and facts and figures discussed in these two body paragraphs.
Skills required for IELTS line graph
Multiple types of skills are evaluated by this type of task. The examiner evaluates you how you capture the graph and its main features, trends, comparable strategies and your writing style. Polish your writing skills to get high bands.
IELTS line graph vocabulary
It is also essential to learn vocabulary for IELTS line graph. IELTS line graph vocabulary is one of the important factors, very useful and helpful while writing the answer of IELTS line graph writing task 1. Some of the main words are given below to practice and write your answer in an effective manner.
Upward trend
Downward trend
Useful linking words in line graph answer
The usage of linking words is important to get good bands in coherence and cohesion and these linking words organize the structure of your answer well. The useful linking words are given below to adapt.
- To begin with, …
- To start with, …
- In case of, …
- And then, …
- At this point, …
- Subsequently, …
- To sum up all, …
- After this, …
- After towards, …
- In turning to, …
- In a nutshell, …
IELTS line graph sample answers

Sample answer:
The line graph shows three types of spreads (Margarine, low fat and reduced spreads and butter) which were consumed during 26 years from 1981 to 2007. The measurement quantity unit gram is used in the line graph.
Overall, the consumption of low fat and reduced fat increased during the period while butter and margarine spreads decreased in 26 years. In the starting of the time, butter was very famous but with the passage of time, it dropped. While in case of margarine, it was the second most popular and stable during the time period, but in final years it decreased from both margarine and low fat and reduced spreads. Low fat and reduced spreads rose from both of them in final years.
Turning to the quantity of spreads, butter began from 140 grams from initial years and peaked to 160 grams in 1986. After it, decreased and got the position at 50 grams in final years. 90 grams margarine was eaten, rose slight in the mid and decreased in final years nearly to 40 grams.
While the trend of low fat and reduced spreads started in mid of the years mean in 1996 and got highest position at 80 grams from both butter and margarine within the time duration of 5 years. It decreased slight and reached 70 grams in final years.
Words count: 222

The line graph depicts varying city population percentages in four Asian countries from the period of 1970 to 2020, with predictions for 2030 and 2040.
Overall, there is increase in the percentage of the population living in the cities of four Asian countries. This augmentation is predictable to be same or increase more in future. According to the line chart, Malaysia is one of the highest in the rate of population increasing countries in which people turn to live in city.
30 percent of the population lived in the cities, if we talk about Philippines and Malaysia. There is expected for Malaysia that city population will increase 80%. While Philippines is expected from 45 percent to 55 percent.
In order to talk about Thailand, there was 20 percent population in cities in 1970 and there is a guess to increase 30 percent in future. In case of Indonesia, city population was 15 percent and rose 50 percent in 2020, while expected to 60 percent in 2040.
Furthermore, predictions describe that there will be more growth in city population in coming years. In 2040, it is expected that Malaysia will be at top in city population nearly to 85 percent, Indonesia will be second near to 65 percent. While the figures for Philippines and Thailand will be near to each other predicated to 55 percent and 50 percent approximately.
Words count: 231

The line graph depicts the average cost that American customers spent on mobile and landline phone services during the period of 10 years.
Overall, the landline phone services were declined every year while in the case of mobile services, it grew every year. Both of the services reached at same point in 2006.
In 2001, spending on mobile phone services began near to 200 US dollars, while the amount for landlines phone annual expenditures was 700 US dollars. Within the duration of 5 years, expenditures for landlines services dropped and expenditures on mobile phone services rose to 500 US dollars.
In turning to the year 2006, both services mobile phone and landline services met at the same point expenditures that was about 550 US dollars. Later on, mobile phone services continued to rise and its expenditures reached at 750 US dollars in 2010. While in the case of landline phone services, the expenditures decreased regularly and in 2010, the expenditures were 450 US dollars.
Words count: 161

This line graph illustrates information about number of passengers using underground station in London around the clock of a day. According to the line graph, the busiest time at the ground station would be 8:00 AM to 6:00 PM.
A large number of passengers who traveled using the underground station were at morning, 8:00 am. This amount increased during first two hours from 6:00 am to 8:00 am, when around 400 number of people traveled by underground station. The number of people dropped to half, at 10:00 am. After it, passengers again rose between the duration of 11:00am to 3:00 pm where near to 300 people travelled using the underground station.
While in afternoon, trend went to downward where just 100 people used underground station to travel. In the evening, at 6 pm, a number of people increased near to 380. After 7:00 pm, the number of people dropped and varied for the last two hours from 8:00 pm to 10:00 pm.
Overall, the number of people increased in morning and early evening to use underground station for traveling.
Words count: 188

The line graph depicts the percentages of citizens who aged 65 or above in three various nations from 1940 to 2040.
Overall, the proportion of the people of aged 60 or above for America and Sweden increased with a slight difference whereas the proportion for Japan decreased first and started to increase in 1990 by slow speed. But in 2020, it increased by high level from both of the countries United States of America and Sweden.
Initially, the percentage of aged people in America was higher with the percentage of 9. The aged people of 65 or over of Sweden were highest in the percentage after America, 7 percent respectively. Japan was the country where the proportion for aged people was least from both of the countries America and Sweden. Just 5 percent of the aged people are there in the Japan. The increasing rate of aged people in America started after 1960 with just 1 percent increment before. The expected increasing proportion of aged people will be 23 percent in 2040 for America. While in the case of Sweden, the population of older people increased and there is expected to reach this percentage to 25 percent while in initial it was 7 percent.
Turing to Japan, the proportion of old people was 5 percent and it decreased with the passage of time while in 2030, the percentage for aged people would increase and it is estimated that it will reach at 27 percent. So, the highest percentage of aged people will lie in Japan.
Words count: 258

The line graph illustrates the changes in temperature of three cities (Paris, Dubai and Sidney) in different months of the year. Temperature is measured in temperature unit degree Celsius .
Overall, Paris is the coldest city instead of Dubai and Sydney, while Dubai is the hottest city. In case of Sydney, the temperature is opposite of Dubai and Sydney.
Turning to line graph, the temperature never goes above 20 degrees Celsius. While the temperature of Dubai never drops below 18 degrees Celsius. There are similarities between Dubai and Sydney, the temperature in March and December remains same between 23 and 24 degrees Celsius.
In the months of May and September, the temperature of Paris and Sydney remains similar near to 15 degrees Celsius. If we talk about the highest temperatures in Paris and Sydney, the highest temperature is 20 and 24 degrees Celsius respectively. In case of Dubai, the highest temperature lies at 36 degrees Celsius. The lowest temperature is in Paris instead of Dubai and Sydney.
Words count: 170
IELTS line graph sample questions to practice
IELTS writing task 1 line graph sample questions are there to practice and perform well in exams. These sample questions for IELTS writing task 1 are given below to solve. If you face any difficulties during practice, you can contact us by comment section or other social media sites that are provided in the end. I will try my best to solve your problems regarding IELTS writing task 1 line graph questions and overall IELTS.

Employment rates of men and women in three countries in Europe in 1991

Common errors in describing line graph
There are two common problems found in IELTS writing academic task 1. Therefore, practice best and avoid to do such types of mistakes:
- Most of the aspirants try to solve the line graph but they do not provide the required details of the graph.
- Aspirants do not focus on figure and they direct start to describe.
Tips for IELTS writing task 1 line graph
IELTS writing task 1 line graph tips are very helpful in your IELTS exams. These tips for IELTS writing line graph are mentioned below:
- Be focused on title of the line graph, because you have to write it in your overview.
- In the introduction, you can paraphrase the question of line graph asked in the test of IELTS writing task 1 as a question statement.
- You have to explain all features in your body paragraph 1 and 2.
- You are required to write sum up discussion in overview.
- Follow X-axis and Y-axis in the same way to describe the information given in the line graph.
- You have to practice different types of line graphs to get good bands.
- Build strong vocabulary for writing test, because you are not allowed to repeat same wording in your writing. Write wide range of words in your answer.
- Cohesive devices make your writing effective, so do not forget to use them.
In a nutshell
In IELTS writing task 1 line graph, you face a line graph in which specific type of data is provided. In line graph, the data or information vary from one aspect to other. In this type of task, you have to explain the information given in the line graph. The answer for IELTS line graph essay must contain all main features of the data given in IELTS writing task 1.
IELTS writing task 1 line graph sample answers are very helpful in the question types of IELTS writing task 1 line graph. Advance vocabulary, sample questions, common mistakes, skills, procedure to answer in line graph and tips to solve IELTS writing task 1 line graph are essential to perform excellent in IELTS writing.
Frequently asked questions (FAQs) about line graph
These are the graphs in which different types of changing information or data can be found. They have an x – axis and y – axis in the graph having information.
There are 6 types of charts/graphs in IELTS writing task 1 which are mentioned below:
- Process diagram
There are four components of an answer essay of line graph:
- Introduction
- Body paragraph 1
- Body paragraph 2
There are three different types of line graphs:
- Simple line graph : There is just one line plotted on graph.
- Multi-line graph : There are two or more lines in this type of graph.
- Compound line graph : In this type of graph there are multiple lines and having the area of shadow or shaded area.
You are not allowed to write conclusion in the line graph essay, you can write an overview.
Exactly, dedicated and advance vocabulary makes your writing effective.
You have to explain all features and main information included in the line graph. First, write an introduction to paraphrase the question, then write overview in which you have to paraphrase the title of the line graph and explain other details in body paragraph 1 for one aspect and body paragraph 2 for another aspect.
Similar Posts

IELTS Listening Guide and Strategies
In this article, you will be learn about IELTS listening guide. What is IELTS Listening test? IELTS Listening and speaking test are same for both…

IELTS Writing Task 1 Line Graph Vocabulary
Vocabulary plays an important role in the module of IELTS writing as well as for line graph. In terms of getting good bands in IELTS…

How to Describe a Bar Graph in IELTS Writing Task 1
IELTS bar graph is a common question type in the test of IELTS writing. Therefore, it is important for you to learn the method how…

A Complete Guide for IELTS Writing Task 2
Writing is one of the modules of IELTS (a language proficiency test used to go abroad for work, study or immigration where English is the…

How to Describe IELTS Writing Task 1 Pie Chart
IELTS writing task 1 pie chart is a round shape chart which is divided into different segments. Each segment contains specific information in the pie…

How IELTS band scores are calculated?
Its test which is conducted to check and clear the proficiency of English language. This test consists of four sections The band scores are calculated…
IELTS Preparation with Liz: Free IELTS Tips and Lessons, 2024

- Test Information FAQ
- Band Scores
- IELTS Candidate Success Tips
- Computer IELTS: Pros & Cons
- How to Prepare
- Useful Links & Resources
- Recommended Books
- Writing Task 1
- Writing Task 2
- Speaking Part 1 Topics
- Speaking Part 2 Topics
- Speaking Part 3 Topics
- 100 Essay Questions
- On The Day Tips
- Top Results
- Advanced IELTS
How to write a line graph for IELTS writing task 1
Learn how to describe a line graph for IELTS writing task 1. IELTS Line graphs are common in writing task 1 along with bar charts, tables, maps, diagrams and pie charts. This lesson was last up-dated in 2018.
The guidelines below will help you structure your line graph answer and focus on the right aspects for a high score.
Steps: How to write IELTS Line Graphs
- try to include all information from the two axis and the names of categories.
- do not divide your key points into different paragraphs. Make sure you include the main increases and decreases shown.
- Use different verbs and nouns
- Use a range of adjectives and adverbs
- Vary your time phrases
- Click here to get a word list: LINE GRAPH VOCABULARY
- Don’t always give from … to … for the amounts, sometimes you can give the difference “it increased by double..”.
- Put numbers or percentages to support your sentences in the body paragraph. Failure to do that will result in a low score.
- Leave an empty line between paragraphs to make them easier to see. This is not a rule, it is a strong recommendation.
- If the line graph contains many lines and a lot of movement, be selective. You are being marked on your ability to select key features.
- Don’t spend more than 20 mins on task 1. You will need a full 40 mins for task 2.
- Write 150 words or more. Aim for about 160-190 words. Don’t write under the word count.
- Click here: IELTS Writing Task 1 Model Answers
Line Graph Sample
It is not common to be given only one line in IELTS writing task 1. However, this answer will provide you will an example of vocabulary, layout and general content.

- Source: IELTS Liz
Line Graph Model Answer
The graph illustrates how many people from the age of 65 and above were reported to have contracted influenza in a particular village in the UK from 1985 to 1995.
Overall, the number of cases of elderly people with influenza increased over the period given. The highest number of people with the illness can be seen in 1991.
In 1985, the number of cases of influenza stood at 40 and then rose steadily over the next three years to reach 55 in 1987. In the following year, 1988, the figure dipped slightly to below 50 after which it rose significantly to reach a high of 75 in 1991.
From 1991, there was a decrease to about 60 in 1993 of the number of reported cases of influenza. From this point, except for a slight increase of about 5 cases, the number remained at about 60 at the end of the period.
Focus Points:
Take time to read through the model and pay attention to:
- the content of each paragraph
- the use of verbs, nouns, adverbs and adjectives
- the logical order of information in the body paragraphs
Please note: this is a practice exercise lesson. It is rare for IELTS to give a one-line graph. So, use this to practice language and technique.
Recommended
- IELTS Writing Task 1: Tips & Model Answers
All the best
The line graph illustrates how many number of cases of elderly people over than 65 years, who infected by influenza in some UK village between 1985 to 1995.
Overall, the number of reported people with influenza had been increased over given time. The highest reaching point the influenza cases had been reported was in 1991 for about 75 cases.
is it okay to use [the number of ] more than 4 times
There is no rule that states how many times a certain word can be used. The marking system doesn’t work this way. For example, the word “people” is likely to be repeated a number of times in some IELTS writing task 2 essays and that is fine, even for a high score essay. As long as there is a range of language in your task 1 report and you have demonstrated the skill of paraphrasing, such as “the figure” or “how many”, you can repeat words within reason. IELTS Writing Task 1 is short, roughly between 7 and 9 sentences on average for a high band score report, and within those few sentences you need to show range of vocabulary. So, while there is no rule, I’m sure when you proof read your writing, you can see whether or not you have too much repetition.
Thanks a billion dear Liz.
You’re welcome 🙂
You are doing a wonderful job, Liz. May God always keep you healthy, happy, and prosperous. I have been teaching for the past 27 years and I still see that there are only a handful who are committed to teaching. You really are one of those. Kudos, Liz.
Thanks. That’s a really kind comment.
Thanks a million.💝💝💝
Hi, Liz. Please evaluate.
The graph illustrates the number of people aged 65 years and above with influenza in a particular village in UK between year 1985 to 1995.
Overview, the number of infected aged people with influenza increased over the years. In the year 1991,the highest number of people with the case were reported, whereas the lowest case was reported in 1985.
In 1985, the number of cases of influenza stood at 40 and then rose steadily to 55 in 1987. There was a slight fall in the number to 50 in the subsequent year afyer which it leveled off to hit a high of 75 in 1991.
Between 1991 to 1993, there was a drop from 75 to 60 in the number of people reported to be infected with influenza. The number remained constant at 60 from 1993 to the final year except for a slight increase of 5 cases reported in 1994.
Please Evaluate. The graph illustrates the number of people above the age of 65, who got infected by influenza flu in a particular village in the UK from 1985 to 1999. Overall, the number of cases of influenza increased over the time span, the least number of cases was 40 in the starting year while the maximum number was 75 in the year 1991. At the beginning of the period, the number of people infected with flu was 40, which increased to 55 in 1987 before dipping down to just below 50 in 1988. Afterwards the figure got a increment till it reached a high of 75 in the year 1991. After the year 1991, the cases of influenza saw a drop till they reached 60 in 1993 . From this point a slight increment (about 5 cases)was seen in the number in the year 1994 but in the last year figure dropped to 60.
Hi Liz thanks a bunch for your beneficial tips and answers. Honestly I’ve got a problem!! Is the “overview” of writing task 1 necessary? I mean we don’t have to use any numbers in it??? Cause i’m really confused. I live in Iran and I’ve taught to prepare my writing in just 3parts including: Introduction 2 or 3 body paragraph and Conclusion! Without overview. WHAT SHOULD I DO??
The overview is the most important paragraph for academic writing task 1. It contains a summary of the key features. This means you collect and describe all key features in that paragraph. The numbers and detail, you present in the body paragraphs. See my model answers and tips about the conclusion: https://ieltsliz.com/ielts-writing-task-1-lessons-and-tips/
Thank you Liz. It’s really effective.
Hello Liz, Thank you very much for the content that you produce. I’m using it as a main source for my IELTS preparation. I’m struggling a lot with identifying key features of a graph. Not sure why, but I usually end up writing too much information in an overview. Do you have any suggestions or tips on how to properly identify the key features for the overview? Thank you in advance.
Give a bird’s eye view – what goes up or down over the period. Then mention which might be higher or lower. Those are two key features that are in most line graphs. Another option is to add an unusual key feature – ie when lines show opposite trends (but this isn’t common). So, the two common key features I mentioned will be two sentences – one each. Your task is to simplify what you see – not complicate it.
thank you liz.Your lessons are too helpful.
Hi , Can you please let me know that is it ok to use brackets in your writing tasks ?
See my model answers for writing task 1 on this page to learn your answer: https://ieltsliz.com/ielts-writing-task-1-lessons-and-tips/
Hi liz, Somebody told me that, for graphs ‘Overall Statement’ should put at last, rather than within introduction or second paragraph. To what extent it is right??
There are no rules about this. The examiner will mark you based on logical organisation. Your overview statement can come before or after the smaller detail. This means it comes before or after the body paragraphs.
Mam, as you said before, I would prefer “overall” just after the Introduction paragraph. thank you so much for your worthful lessons! All of the classes are excellent and it means a lot…
Hello liz I couldnot find your answers for all the writing task 1 ,i had found it once,but now i could’nt find it again rather those in the home page..please help me this..that is really usefull for me.
Go to the red bar at the top of each page and click on the words: Writing Task 1. All main pages are accessed through the red bar.
Thank you so much for your valuable guidance. I request you to provide one more example on line graphs which has 3-5 lines so that it would be better to learn and write in the exam. I also want to inform you that I am planning to appear for my IELTS in the month of October and your website is the only source for me to study. So I request you to help me in this and i hope that it would be better for others also. Looking forward to get positive response from your side. Thanks again in the advance.
IT’s certainly something I will put on my list of things to do, but I’ll actually be taking a break in September and possibly October too. Only a few reading or listening lessons will be posted during that time as well as updated topics.
and plateau word good for line graph
If you don’t know it, don’t use it.
Hello Liz mam, I’ve a question. Can we use both verb+adverb and adjective+noun in a line graph or we have to choose only one pair for whole graph. Thanks in advance.. Abdul….
You should alternate so that you demonstrate your language skills.
Dear Liz, It is possible in Writing task 1 just have 1 body paragraph ?
If you want a good band score, then you need to demonstrate the skill of organising paragraphs. See the band score requirements.
Excuse me, Why ‘the origin number’? I think that should be ‘the original number’
Thanks for spotting it. It’s a typo. Liz
Dear madam,can we mention dates in overview paragraph.what I mean is that mentioning time phrases ” at the beginning of the period,during mid years,at the end of the period” while describing key changes would’nt be better instead of writing specific dates such as,1999,2000 or it does’nt affect much.
https://ieltsliz.com/ielts-liz-news/
hey Liz thnas for everthing
Hi Liz, Question about the intro, how come it is “over 10 years” when it is from 1983-1992? Thanks, Joharra
The word “over” does not mean “more than” in this context. It refers to over the period. There are 10 years given. Liz
Hi Liz, Just a follow up question. So the counting of years should start at the first given year, which is 1983? However, 1983 + 10 = 1993. In the line graph it is 1992. There was another essay says 26 years (1981-2007) which is correct when being added (1981 + 26 = 2007). Just really curious. Do you have any explanations about this? And one last question, should the overview be in a separate paragraph or part of the intro? Thanks a lot! Joharra
You can count it on the graph, not by doing calculations. Just look at the graph and count. Liz
Thanks! that makes everything clear 🙂
Hi Liz, thank you so much for you free lessons, thank you for teaching me that overview contains the key features or the highest or the lowest point ..but i am still struggling to understand the real content of overview, I would like to ask about your overview above, you wrote” Overall, the number of cases of disease X remained below 200 over the period given except for a considerable surge between 1989 and 1991 when the figures doubled.” -In 1991, the number of cases is actually 350 which is not double of 200, so, is it still fine or accurate to say that” the figure doubled”? or should we say ”…the figure almost doubled?because it is doubled in 1989 (400 cases) but not in 1991 (350 cases). or does the accuracy of information we give in overview is not 100% required?
My last question is about Grammar, would you please explain a bit more when we put ”s” in ”figures”? One student wrote ”’The figures rose steadily in the next four years, to reach its first peak in 1987” and you asked to take off ”s” in figure. when we should not put ”s” like”figure”?thank you.
The overview contains a description, so if we write “it doubled” as a description it is fine. But you can certainly make it clearer by writing “it more or less doubled”. As long as you don’t write “it doubled exactly”. But you need to understand that we are not referring to details. In the first years the numbers were 200 and under, then they reached 400. The description is “doubled”. If you get lost in details, then it isn’t an overview.
Usually, we write about “the figure” rather than using the plural. All the best Liz
Many thanks, God bless you!
I am from Mongolia. I am doing independent study on the preparation of IELTS examination. Thank you for helping the students like me around the world. I would like to kindly ask you to check my writing below in order to let me know my writing skill in task 1.
The line graph illustrates the amount of goods transported in four different ways (road, water, rail and pipeline) in Uk between 1974 and 2002. The units are measured in million tonnes.
Overall, over the period, the highest amount of goods was transported by road while the least amount of goods was transported by pipeline. Interestingly, all the amounts of goods were increased over the 28 years except the amount of rail transportation which almost reached back to it’s original number.
In terms of the road, the amount of goods was transported, it began about 70 million tonnes which rose steadily over the following 18 years to reach over 80 million tonnes in 1992. In the following 4 years, there was a gradual decline after which it grew up to nearly 100 million tones. Likewise, about 39 million tonnes of goods was transported through water in the first year and then the figure fluctuated slightly and rose to about 65 million tones. Similarly, in 1974, the figure of the pipeline transportation stood at about 5 million tonnes and there was a steep fluctuation until it leveled out from 1995 to 2002.
On the other hand, the amount of goods was transported by train was 40 million tonnes in 1974 which was followed by slight changes and reached at just above it’s beginning figure of 40 million tonnes.
Please read my notice: https://ieltsliz.com/posting-writing/ Thanks Liz
how to write bar graph
There is a free video and other lessons for bar charts on this page: https://ieltsliz.com/ielts-writing-task-1-lessons-and-tips/ Liz
Hello How can apply this sentence structure. Subject+ verb + proposition + indirect object + direct object. In graph and essay
You will find sentence structure lessons for line graphs on this page: https://ieltsliz.com/ielts-writing-task-1-lessons-and-tips/ Thanks Liz
Speak Your Mind Cancel reply
Notify me of new posts by email.
Advanced IELTS Lessons & E-books

Recent Lessons
Ielts liz personal update 2024, ielts model essay -two questions essay type, ielts bar chart of age groups 2024, ielts topic: urban planning, ielts listening transcripts: when and how to use them, 2024 ielts speaking part 1 topics.

Click Below to Learn:
- IELTS Test Information
Copyright Notice
Copyright © Elizabeth Ferguson, 2014 – 2024
All rights reserved.
Privacy Policy & Disclaimer
- Click here: Privacy Policy
- Click here: Disclaimer
Return to top of page
Copyright © 2024 · Prose on Genesis Framework · WordPress · Log in
- Skip to main content
IELTS Podcast
Pass IELTS with expert help.
Line graph example
Ielts line graph sample essay.
Home » IELTS academic task 1 » Line Graph Sample Essay
Line graphs come up often in IELTS writing part 1. We will show you how to confidently answer questions about line graphs, helping you practice summarising the data and identifying trends.
For each line graph (or line chart) question, you will need to summarise the information by selecting and reporting the main features and make comparisons where relevant. You should write at least 150 words. To make the best use of your time it’s important to write with a clear structure, focus on the most important trend or trends, choose appropriate vocabulary and avoid common mistakes.
In this tutorial, we have a band range 6.5 / 7 academic task 1 IELTS line graph example essay graded by an ex-IELTS examiner (on our team of essay correctors). There are some great examples of useful feedback to help you improve your own line chart answers.
This line graph tutorial will help you:
- Choose the right information
- Use the right sentence structures
- Decide on the perfect tense to use
Each criteria has been considered and r eviewed by one of the ex-IELTS examiners on our team. T he different sentences in the essay have been colour coded to correspond to the four marking criteria used by the British Council / IELTS IDP . At the IELTS podcast website, we also have an amazing essay correction service if you need help with your IELTS writing, so this is an example of the personalised feedback you could receive.
Make sure you understand what the codes mean:
- TR means task response – have you summarised the main information and made comparisons?
- CC is coherence and cohesion (does your essay ‘flow’ well, does it make sense?)
- LR is lexical resource (or vocabulary)
- GR means grammar
Therefore TR1 is the first comment about Task Response.
Example line graph question:
The line graph shows the average rainfall for three countries in Great Britain over a 12 month period in 2018. Summarise the information by selecting and reporting the main features, and make comparisons where relevant. Write at least 150 words

The line graph reveals the information of rainfall in three countries: England, Scotland, and Wales for one year starting from January to December in 2018.
In England, the amount of rainfall in January was recorded just above 100ml, which slightly increased in the next month by 5ml, and dipped to 90ml in March. The trend of raising and falling continue for a couple of months and reached its lowest figure in the graph for the month of June at around 70ml. After that, it is predicted that the level of rain will fluctuate and will remain around 120ml in December.
In Scotland, the amount of rain in January was 125ml, dropped unexpectedly to its lowest level to 20ml in February, and rocketed in next month to its peak value of 135ml. In April, the amounts of rain were less than 50ml, then start went up slightly until June. Then after it is predicted to drop until September, the following month it will start climbing up to October, and it will be decreased to 50 ml before reaching to 105 ml in December.
In wales, the rainfall was 50ml in January increased slightly in February and decreased to its lowest point in April around 30ml. In next month went up sharply to 110ml and dipped by 50ml in June. It is predicted that the highest amount of rain will be in July at 125ml and went down just below the month of June’s record. It will remain constant for two months before reaching 105ml in November and it will dip down in December to 52ml.
Overall it can be clearly seen that in each country the amount of rain in January will be approximately same in the month of December.
Let’s look at the essay above with ex-IELTS examiner commentary on each section.
The line graph reveals the information of rainfall (LR1) in three countries: England, Scotland, and Wales for one year starting from January to December in 2018.
TR1 – A good opening paragraph. Effective use of paraphrasing and you have included the key information.
LR1 – This could sound more natural. Perhaps ‘shows information about rainfall’, ‘shows rainfall statistics’ or ‘shows how much rain fell…’?
In England (TR2), the amount of the rainfall (GR1) in January was recorded just above 100ml, which slightly increased in next month by 5ml, and dipped to 90ml in March. The trend of raising (LR2) and falling continue (GR2) for a couple of months and reached its lowest figure in the graph for the month of June at around 70ml. After that, it is predicted that the level of rain will fluctuate and will remain (TR3) / (GR3) around 120ml in December.
TR2 – Good to adopt a systematic approach to presenting the information
GR1 – the amount of rainfall
LR2 – Check the difference between ‘rise’ and ‘raise’. GR2 – continued
TR3 – Make sure you report the information accurately.
GR3 – Stick to using past tenses here as all the information relates to 2018
In Scotland, the amount of rain in January was 125ml, dropped (CC1) unexpectedly to its lowest level to 20ml (CC2) in February, and rocketed (LR3) in next month (GR4) to its peak value (LR3) of 135ml. In April, the amounts of rain were less than 50ml, then start went up (GR5) slightly until June. Then after (CC3) it is predicted to drop until September, the following month it will start climbing up to October, and it will be decreased (TR4) / (GR6) to 50 ml before reaching to 105 ml (LR4) in December.
CC1 – You need to link your ideas together in an appropriate way. Perhaps ‘125ml, and this figure dropped…’?
CC2 – As before. Perhaps ‘… to its lowest level, 20 ml, in February’?
LR3 – Accurate use of some key language to describe graphs.
GR4 – in the next month GR5 – started to go up
CC3 – Take care with your use of linking words.
TR4 – As with the previous paragraph, make sure you report the information correctly.
GR6 – Stick to using past tenses as all the information relates to 2018.
LR4 – Omit the ‘to’ – ‘… reaching 105ml…’
In wales (GR7), the rainfall was 50ml in January increased (CC4) slightly in February and decreased to its lowest point in April (LR5) around 30ml. In next month went up sharply to 110ml and dipped (LR6) by 50ml in June. It is predicted that the highest amount of rain will be in July (TR5) / (GR8) at 125ml and went down just below the month of June’s record. It will remain constant (LR7) for two months before reaching 105ml in November and it will dip down in December to 52ml.
GR7 – Take care with your use of punctuation. Use a capital letter for the name of a country.
CC4 – You need to be careful with the way you link your ideas together. Perhaps ‘… in January and this figure increased…’?
LR5 – Very natural use of language.
LR6 – Good to incorporate a wide range of appropriate vocabulary.
TR5 – As before, you need to report the information accurately.
GR8 – As in the previous paragraphs, this is an inappropriate use of tenses.
LR7 – Despite the problems with tenses, this vocabulary is appropriately selected.
Overall it can be clearly seen that (CC5) in each country the amount of rain in January will be (TR6) / (GR9) approximately same in the month of December. (TR7)
CC5 – On the right track to introduce the main features of the graph.
TR6 – As before, there are problems with task achievement.
GR9 – Inappropriate use of tenses.
TR7 – I think this paragraph is intended to be your overview? If so, this would be a useful area to work on as it is one of the key differences between a ‘6’ and a ‘7’ for task achievement.
PROBABLE IELTS SCORE: 6.5 / 7.0
Some final practical advice for answering line chart questions in your IELTS test:
- Do not start writing before giving yourself enough time to think. First decide the language you will need in your answer. Give yourself 5 minutes to look, think and plan.
- Study the line graph carefully: be clear about the topic and what each line represents.
- The labels on the axes will give you useful information. Look at the horizontal axis to understand the period of time shown, and the vertical or x axis to see how the data is shown (in centimetres, in dollars, in millions?)
- Check the time frames very carefully in the line and plan how time differences will affect your choice of verb tenses.
- What is the main trend or trends?
- The easiest way to make comparisons is by using superlatives in your answer. For example: comparing the largest and smallest amounts of rainfall by country or comparing the least and most expensive products over time.
- Say how two or more lines are related – do they both increase over time? Are any points connected?
- Finally, make sure you have included an overview!
Audio tutorial with transcript
You can download or listen to the audio version here:
| Direct Download Here | Stitcher | iTunes | Spotify | Soundcloud | Transcript |
IELTS task 1 line graph video tutorial
More useful IELTS Academic Task 1 lessons:
- Academic Task 1 Sample Essays
- How to describe a pie chart
- Bar Chart IELTS
- How to describe a map
- Describe an image
- Describe a natural process
- How to describe a table
- How to paraphrase
- Line graph sample answer
- Marking criteria for Task 1
- Map vocabulary for IELTS Task 1
- How to describe a flow chart
- Essential skills for Task 1
- How to get band 9 for academic task 1
- How to describe a process diagram
Podcast: Play in new window | Download
Press ESC to close

IELTS Writing Task 1 Line Graph Examples: Here’s a Guide to Master the IELTS Essays
One of the most popular essay topics in the IELTS writing task 1 is explaining the line graph. This is a type of essay where you will have to explain the data given in the form of line graphs. This task is particular to the academic writing and the general candidates need not worry about this.
As you must know that the IELTS writing task 1 line graph is the shorter of the two tasks and needs to be written in 150 words at least. It is also necessary that you finish this task in no more than 20 minutes, as the second task is lengthier and as such, requires more time. Let us get into the details of line graph essays.
Skills Tested in IELTS Task 1
In IELTS writing task 1, you will be asked to describe facts or figures presented in one or more graphs, charts or tables on a related topic; or they may be given a diagram of a machine, a device or a process and asked to explain how it works.
Important Points
You must write in an academic or semi-formal/ neutral style and include the most important and the most relevant points in the diagram.
This task assesses your ability to identify the most important and relevant information and trends in a graph, chart, table or diagram, and to give a well-organised overview of it using language accurately in an academic style.
You will also be judged on how appropriately, accurately and relevantly the response fulfils the requirements set out in the task, using the minimum of 150 words.
Further Assessment
- You will be assessed on how your response organises and links information, ideas and language with appropriate use of cohesive devices (for example, logical connectors, pronouns and conjunctions) to assist in making the conceptual and referential relationships between and within sentences clear.
- You will also be judged on your use of a range of vocabulary and grammatical devices and its accuracy in terms of the specific task.
How to Structure IELTS Writing Task 1 Line Graph Essays?
Structuring a line graph essay is not a big deal. All you need to remember is that you do not need a conclusion here. As this isn’t a discursive essay, so conclusions do not serve any purpose. Here is an IELTS sample essay to know how you can structure a line graph essay:
Paragraph 1 (Introduction)
- Sentence 1- Paraphrase Question
This paragraph should be one sentence long and demonstrates your ability to paraphrase. You should do this by using synonyms.
Paragraph 2 (Overview)
- Sentence 1- Overview of the first main feature
- Sentence 2- Overview of the second main feature
- Sentence 3- Make general comparison, if appropriate
An overview is a general statement, highlighting the most important information in the table. It should not include any numbers. This is just a summary of the main features. You can use numbers to support your answer in paragraphs 3 and 4.
The examiner is testing your ability to identify the most important information and then summarise it. Important information could include general trends, increase/ decreases, differences, comparisons etc.
Paragraph 3 (Details of significant feature 1)
- Sentence 1- Supporting details
- Sentence 2- Supporting details
- Sentence 3- Supporting details/ comparison details, if appropriate
In this paragraph, you take the first general statement from paragraph 2 and support it with details from the graph. The examiner is looking for your ability to choose the correct data and ability to describe data, trends, comparisons etc.
You then repeat this process for paragraph 4, only this time you describe the second sentence in paragraph 2.
Paragraph 4 (Details of significant feature 2)
There may also be three significant features, in which case you can adjust the structure slightly.
You must remember not to write a conclusion. Conclusions are for opinion or discursive essays and you are not expected to do this in task 1.
Also Read : 9 Practical IELTS Letter Writing Tips: Guide to General & Academic Writing
IELTS Writing Task 1 Line Graph Example Essay Question
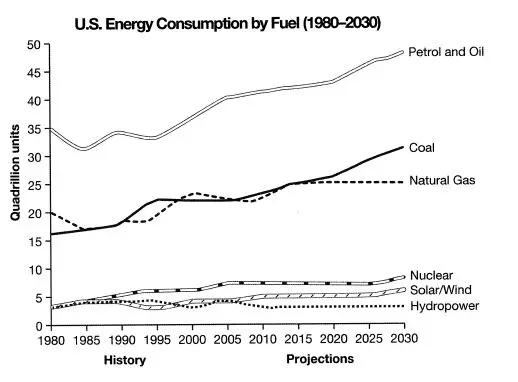
Source: Cambridge English IELTS Past Papers.
The IELTS writing task 1 line graph gives information from a 2008 report about the consumption of energy in the USA since 1980 with projections until 2030.
Summarise the information by selecting and reporting the main features, and making comparisons where relevant.
IELTS Sample Essays Answer
The line graph shows energy consumption by fuel type in the United States from 1980-2008, with projected use until 2030.
Overall, fossil fuels have been the dominant type and will continue this trend into the future. Nuclear and renewable energy sources have represented a small but significant proportion of total energy use and despite small projected gains; it is projected that they will continue doing so.
Main Information
Petrol and Oil commanded the biggest share with 35 quadrillion units (35q) in 1980, rising to approximately 40q in 2008 and this trend is set to continue with a projected value of nearly 50q in 2030. In 1980 natural gas and coal came in second and third, with around 16q and 20q respectively. However, coal overtook natural gas in 1990 and despite some fluctuation, is set to be the second most used fuel in 2030 with just over 30q. It is predicted that natural gas will level off and remain relatively constant at about 25q.
Nuclear and the renewable energies all represented around 4q in 1980 and fluctuated up until 2008. It is speculated that nuclear energy will reach 10q by 2030 and solar/wind around 5q, with hydropower dropping and then remaining constant at approximately 2q.
Academic writing task 1 is a writing task which has a defined input and a largely predictable output. It is basically an information-transfer task that relates narrowly to the factual content of an input diagram and not to speculative explanations that lie outside the given data.
You can take help of any good IELTS online training programs for enhancing your skills in this topic. A proper IELTS online preparation will help you with the most important part and that is choosing the correct information. If you know what to put into the essay and have a concrete structure, you are absolutely good to go!
Also Read : Duolingo Test Scores Explained: Comparison with IELTS and TOEFL
One Comment

I was looking for this article for the preparation of graphs and how to write essays, this was very useful, what are you looking for?
Leave a Reply Cancel reply

Share Article:
About the Author
Indulekha prabha.
My name is Indulekha Prabha. I am an English teacher and a content writer by profession. When I'm not working you can find me writing fiction, reading poetry and painting.
You might also like

Describe Something Important that has been Kept in Your Family: A Cue Card Sample Topic for IELTS Speaking

How to Use an IELTS Calculator? Calculate Your Overall IELTS Exam Score

What is a Good IELTS Score? Is 7.5 a Good IELTS Score? Here’s All You Need to Know
Other stories, top ielts classes in ambala: all you need to know to score better, how to sound more confident in the ielts speaking test effective speaking practice guide.
How to answer line graph essay in IELTS writing task 1 Academics
- IELTS Writing Academics Task 1
Line graph accounts for one of the most popular essay topics in the IELTS writing task 1. In this type of essay, you have to explain the data given in the form of line graphs.
This type of task is particularly asked in academic writing not in general. So, if you are preparing for the IELTS general writing, then you can skip the essay.
The line graph essay in IELTS writing task 1 Academics requires you to write an essay in atleast 150 words. Also, it is required of you to finish off the task within 20 minutes.
Here in this article, we are going to talk about what line graph essays are and how you should answer them to achieve the desired band score.
What is a Line graph essay?
A line graph can be used to show the change in the phenomenon over time. These types of graphs can be used while plotting the data that have peaks (ups) and troughs. In other words, the line graph helps in highlighting the trends.
What is the main purpose of a line graph?
The main purpose of the line graph is to determine the relationship between two sets of values. In this, one data set is dependent on the other.
In the IELTS writing task 1, you will be required to describe facts or figures presented in one or more graphs, charts, or the topic. You can be asked to explain a diagram, a device, or a process, as to how it works or functions.
Part 1- part 1 includes the information given in the graph and the question.
Part 2- You should utilize this information to make comparisons and connect the parts of information to develop your answer.
Part 3- the graphics (line graph)
What is the aim of the Line Graph essay test?
The line graph essay task in the IELTS writing section 1 assesses your ability to identify the most important and relevant trends and information in the graph and to give a well-organized overview of it using the right tense and vocabulary.
You will be judged based on how creatively you link the information, language, range of vocabulary used, and its accuracy in terms of the task, and appropriate use of cohesive devices.
Instead of just filling the gaps, focus on relevancy.
Look for how appropriate your answer is to the question.
Structure of Line Graph Essay
The structure is the soul of any essay. Therefore, to confirm your 8+ score in the IELTS writing task 1 Academics, you need to develop a perfect structure of the graph based on your understanding of the question.
-621994373.png "line graph essay writing")
Introduction: In the introductory paragraph, you should paraphrase the question. The introductory paragraph should be a captivating one. While writing the introduction, include the main points and an overview of both the points.
Overview: Under overview, you can present your understanding of the whole topic and compare the points to stress your point.
Body Paragraph 1: You can discuss the first main issue in paragraph 1.
Body paragraph 2: Discuss the second main issue without breaking the momentum of the essay.
Marking Criteria of the IELTS Writing test
- Task Achievement
- Coherence and Cohesion
- Lexical Resource and Vocabulary
- Grammar Range and Accuracy
How to plan your IELTS Writing Task 1?
1. Analyze the question It is the first step to framing your answer in the IELTS Writing task1 Academics. Read the question; understand the type of question, figures, and axis to frame your answers.
2. Identify the main features For distinguishing the theme and the context, you need to identify the main features in the graph question. Pick 2-3 important trends and elaborate on the same to frame your answers.
3. Brainstorm the ideas and vocabulary Essay writing requires you to be calm and frame your strategy. You have to explain your point with atleast 150 words. Therefore, the usage of the right vocabulary and organization of ideas is critical at this stage.
Common Mistakes to Avoid in Line Graph essay test
- Incomplete data analysis
- Writing an explanation of the data
- Not writing an overview
- Mentioning each detail
- Exceeding word limit
- Illogical structure
- Not planning before writing
To conclude, an academic writing task is a task with defined input and output. It is an information transfer task that relates mainly to the factual content of imputing the diagram.
The assistance of good online training programs like Unlock IELTS with Richa will help you with cracking the IELTS Writing task 1 Academics and help you frame answers that fetch your desired score.
Get Free Ebook
Enroll for Free Last Day Strategies

Related Posts

Last Day Strategies : IELTS Writing (Academics)

How to answer table chart essay in IELTS writing task 1 Academics

IELTS writing task 1 Academics: Understanding coherence and cohesion marking criteria

How to Answer Pie Chart Essay in IELTS Writing Task 1 Academics

Understanding Task Achievement Marking criteria in IELTS writing task 1 Academics

Recent Posts

UnlockIelts- Designed for Your Success

Unlock your inner potential – How ‘Unlockielts’ makes it happen for you.

'Crushing The Curve': A Study Plan For Spectacular Results In Unlickielts Courses

'UnlockIELTS' Partner Program - Helping Others Meet Their English Language Goals!

Top 10 Myths About Preparing for the ILETS Exam Debunked

'Unlock' Your Score Today - Access Latest Tools and Techniques for Aceing IELTS Exam!
Frequently asked questions, 1) how to answer ielts academic questions task 1 for line graphs, 2) how to summarize a line graph, 3) what are some tips to crack the ielts task 1 line graph 2020, 4) how to improve ielts writing task 1 line graph vocabulary, 5 ) how do you describe a line graph trend, of , how would you rate this course overall, write a public review.
- Richa Raj
- A Beginner’s Guide to IELTS
- Common Grammar Mistakes [for IELTS Writing Candidates]
Writing Correction Service
- Free IELTS Resources
- Practice Speaking Test
Select Page
Describing an IELTS Line Graph [An Annotated Sample Answer]
Posted by David S. Wills | Mar 13, 2023 | Model Essays | 0
![Describing an IELTS Line Graph [An Annotated Sample Answer]](https://cdn.shortpixel.ai/spai/q_lossy+ret_img+to_webp/ted-ielts.com/wp-content/uploads/2023/03/Describing-a-Line-Graph-1280x640.png "line graph essay writing")
In task 1 of the IELTS writing test, you could be asked to describe a line graph. This is actually very common and so it’s really important that you can do this well.
Today, I am going to show you a typical IELTS line graph and then give you some advice on how to describe it effectively. This will include my own sample band 9 answer, which I will annotate so that you can more easily understand it.
You can read my full guide to describing line graphs here .
The Line Graph – Bakery Sales
Here is our line graph for today:
The graph below gives information about the sales of the three most commonly purchased items in a particular bakery for the year 2014. Summarise the information by selecting and reporting the main features, and make comparisons where relevant.

This is a pretty straightforward line graph and I don’t think there are any particular difficulties here. However, it is important to read the question carefully and analyse the graph before you begin writing.
Note that this is not about all of the sales in this bakery. Specifically, it is about “the three most commonly purchased items.” You should mention that in your introduction or else it may seem as though only three items are available in this place.
What do you Need to Do?
With any graph description, you need to describe the data accurately for your reader. That means your language must be clear and precise. Also, you should not attempt to describe every little detail. Note the phrase “selecting and reporting the main features.” This means you have to be selective. You should also “make comparisons where relevant.”
Looking at this chart, we can see that each of the three lines had a pretty different trend from the others. One line went up and then down. Another went down and then up. A third just moved slowly up. Your job is to explain this effectively.

Remember to group your data logically. There are various ways to do this, but here’s how I will structure my essay:
Why have I organised my information like this?
As I said, there are different ways to do it effectively, but I felt that a good way was to group the final changes together. That’s because it is in these final months that there are substantial changes in the sales positions of these three items.
Normally, I would have grouped the sales of bread and buns together and then kept pies separate. That’s because pies seem to be at a very different level. However, because the sales of pies rose above buns at the end, it seems like an awkward way of grouping the information .
Learn more about task 1 structure here .
Common Problems to Avoid
It is worth mentioning a few mistakes that people often make in IELTS writing task 1. To begin with, you might have noticed the phrase “a particular bakery.” A lot of people try to paraphrase the question and this is a good option for task 1, but it can lead to problems. A “particular bakery” means a single business whose name we have not been given.
In such situations, I almost always write “an unknown ____.” For example, my first line for this essay will be:
- The line graph shows information about sales in an unnamed bakery in the year 2014.
Speaking of paraphrasing, you should also not include any reference to “below.” Whilst the task description is above the graph, your essay will be on a separate piece of paper or on a computer screen. To say “below” would be false information.
You also really need to avoid vague language that fails to convey the ideas expressed in the graph. This is actually one of the most common problems people make in task 1. Always make it clear to your reader that the data refers to sales (in dollar terms) of three select items from one bakery.
Sample Band 9 Answer
Here is how I would answer the question:
The line graph shows information about sales in an unnamed bakery in the year 2014. There are three items listed and their sales varied substantially during the period. In January, bread was by far the most commonly purchased product, with $80,000 of this sold. This was twice as much as the next highest item, buns, and eight times greater than the third one, pies. Over the next two months, however, bread sales plummeted to almost half their initial value while sales of buns increased by fifty percent. From March through to September, buns remained the most profitable item as bread sales fluctuated wildly in second place. Meanwhile, sales of pies slowly and steadily increased. Towards the end of the year, there were more changes. Sales of bread took off from October onwards, surpassing those of buns to become the most profitable item again and reached $80,000 in sales in December. Sales of buns continued to drop, falling into third place after pie sales shot in November and December.
Annotated Version
Now let’s look at the purpose of these sentences:

Final Comments
My structure was simple but effective and my language was accurate enough to convey the data. I picked only the important parts and glossed over the rest. Remember that you don’t have much time to complete this task!
Notice how few numbers there are. Many IELTS candidates make the mistake of cramming lots of numbers into their descriptions. This shows a lack of thinking and it is also a means of avoiding words. However, IELTS is an English test! You need to use words rather than copying numbers from a graph.
About The Author

David S. Wills
David S. Wills is the author of Scientologist! William S. Burroughs and the 'Weird Cult' and the founder/editor of Beatdom literary journal. He lives and works in rural Cambodia and loves to travel. He has worked as an IELTS tutor since 2010, has completed both TEFL and CELTA courses, and has a certificate from Cambridge for Teaching Writing. David has worked in many different countries, and for several years designed a writing course for the University of Worcester. In 2018, he wrote the popular IELTS handbook, Grammar for IELTS Writing and he has since written two other books about IELTS. His other IELTS website is called IELTS Teaching.
Related Posts

Sample IELTS Letter: Leaving a Course
March 22, 2020

Economic Success and Environmental Consequences – IELTS Writing Task 2
January 31, 2022

IELTS Essay on Employment
August 6, 2020

Rubbish: An IELTS Task 2 Sample Essay
August 20, 2020
Leave a reply Cancel reply
Your email address will not be published. Required fields are marked *
This site uses Akismet to reduce spam. Learn how your comment data is processed .
Download my IELTS Books

Recent Posts
- How to Improve your IELTS Writing Score
- Past Simple vs Past Perfect
- Complex Sentences
- How to Score Band 9 [Video Lesson]
- Taxing Fast Food: Model IELTS Essay

Recent Comments
- David S. Wills on How to Describe Tables for IELTS Writing Task 1
- anonymous on How to Describe Tables for IELTS Writing Task 1
- David S. Wills on Writing Correction Service
- James Oluwasegun on Writing Correction Service
- Daisey Lachut on IELTS Discussion Essays [Discuss Both Views/Sides]
- Lesson Plans
- Model Essays
- TED Video Lessons
- Weekly Roundup
Useful Vocabulary for Writing an IELTS Graph Essay

When it comes to IELTS writing task 1, 25% of your marks are for the range of words you use. That means IELTS graph vocabulary is a very important component to review as you prepare for the Writing Task 1. You can start by checking out this IELTS writing task 1 vocabulary guide . And below, I’ll provide an overview of words and useful phrases to incorporate into your writing so that you can get top marks on the lexical resource category and a high band score overall. Basically, the better your IELTS writing chart vocabulary, the higher score you’ll get. It’s not hard, but there is a clear formula to doing well.
How to Use IELTS Graph Vocabulary in Writing Task 1
Because IELTS writing task 1 involves describing a graph or chart of some type, it will help to have a handle on IELTS writing chart vocabulary — words and phrases that help you write about the information on the chart or graph.

How are graphs described in IELTS? Let’s walk through the best vocabulary for the task, step by step.
1. Start With Introduction Phrases
Often ESL students start their essay with ‘The graph shows…’. While this is fine, the verb ‘shows’ could be replaced by a more exciting and high-level vocabulary word. Here are four different prompts to start your essay:

- The graph illustrates the trends in…
- The graph reveals information about the changes in…
- The graph provides the differences between…
- The graph presents how X has changed over a period of…
- DO NOT write the word below or above in your introduction. i.e. The graph above/below shows…
2. Add Suitable Adverbs
Adverbs help express a relation of place, time, circumstance, manner, cause, and degree, and can greatly add some color and interest to your writing as well as show off your range of vocabulary. Unlike adjectives (which describe nouns), adverbs describe verbs, or actions. Here’s a great list of adverbs to use:
3. Use Appropriate Synonyms
Again using a variety of nouns and verbs for words like rise and fall will help increase your overall score. Here are some suggestions:
4. Add Time Phrases
Below are some excellent time phrases with sentence examples:
Using IELTS Graph Vocabulary in a Model Essay
Look at the sample IELTS writing Task 1 graphs on the British Council website . Below is my model answer with useful words in bold:
The bar charts illustrate the trends in computer ownership, with a further classification by level of education, from 2002 to 2010.
Over the period, it can be observed that there was a significant surge in the percentage of the population that owned a computer. In the year 2002, only about 58% of the population owned a computer, whereas by 2010 , this gradually increased to where over three-quarters of individuals had a home computer.
Looking at the information by level of education reveals that higher levels of education correspond to higher levels of computer ownership in both of those years. In 2002, a significantly low percentage of the population who did not finish high school had a computer, but this figure skyrocketed by 2010, going from 15% to over 40%. There were also dramatic climbs , of approximately 30 percentage points, for those with a high school diploma or an unfinished college education (reaching 65% and 85%, respectively, in 2010).
To conclude, during the last decade, there has been a substantial growth in computer ownership across all educational levels.
Other IELTS Graph Vocabulary Resources
Keep in mind that IELTS writing task 1 may contain one of several different types of infographic: a bar chart, pie chart, line graph, diagram, etc. Regardless of the type, you’ll want to have a good handle on IELTS writing chart vocabulary.
For more specific guides to the different kinds of graphs, charts, and graphics you may find on IELTS writing task 1, check out the following resources:
- How to Describe a Bar Chart
- How to Describe a Pie Chart
- How to Describe a Map
- How to Describe a Process Diagram
You can also check out Magoosh’s IELTS linking words PDF for transitions between ideas. Hopefully you’ll start to incorporate some of these key words and phrases, as well as the above suggestions, in your IELTS Task 1 Writing. If you still don’t feel comfortable doing so, consider dedicating more time to your IELTS studies with Magoosh’s fun, engaging IELTS prep for extra practice.

Eliot Friesen-Meyers is the Senior Curriculum Manager for Magoosh IELTS and TOEFL. He attended Goshen College (B.A.), New York University (M.A.), and Harvard University (M.T.S.), gaining experience and skills in curriculum development, ESOL instruction, online teaching and learning, and IELTS and TOEFL test prep education. Eliot’s teaching career started with Literacy Americorps in Pittsburgh, Pennsylvania, and later, taught ESL programs at Northeastern University, University of California-Irvine, and Harold Washington College. Eliot was also a speaker at the 2019 TESOL International Conference . With over 10 years of experience, he understands the challenges students face and loves helping them overcome those challenges. Come join Eliot on Youtube , Facebook , and Instagram . Recent blog posts Complete Guide to IELTS Writing Task 1 Complete Guide to IELTS Writing Task 2
View all posts
More from Magoosh

11 responses to “Useful Vocabulary for Writing an IELTS Graph Essay”
I would like to get sample of all types of graph eassy
IELTS Liz offers a pretty good range of graphs and charts for IELTS Writing Task 1 (Academic) . You can also get a nice selection of these on the official IELTS websites . And last but not least, Magoosh offers a good selection of these types of questions with a Magoosh IELTS Premium subscription. 🙂
Thank you Magoosh for the comprehensive guide. I’m a subscriber to you GMAT course and is now checking out IELTS.
Wanna ask, I read and watched many other sources that says we should not write a conclusion. However, yours did.
So, is it permissible or not permissible?
The concluding sentence is optional–if you have time to write a concluding sentence after writing and reviewing your essay, then it looks good to have a concluding sentence. If you don’t have time to write a concluding essay or you’d rather focus on other parts of your essay, then it’s totally fine to leave it out. You can read more about this in our Complete Guide to IELTS Academic Writing Task 1.
“Growth” is not an noun? Because in the board it’s saying that it is a verb
Thanks for pointing this out! It seems like a mistake on our part. We should probably change that to “grow”. I’ll make a note for our writing team to make this change 🙂
I appreciate you very much. Your blog on Useful Words for Writing an IELTS Graph Essay was the outstanding blog ever. You have given so much good information about the new english words & grammar in your post, which will help me in future. Always keep data like this on your website
I have two significant questions. The first one is related to the unit of measurement in over view. Is it academic? And the second one is of conclusion. Do we need to write conclusion?
Hi Aakash, I’m afraid I don’t understand your first question. Can you please provide some more information? For your second question: a conclusion is not necessary. You can add one if you’d like, but it’s more important to spend time analyzing the graph.
This is one of the best among the essay I’ve read recently.
Thanks for the feedback! 🙂
Leave a Reply Cancel reply
Your email address will not be published. Required fields are marked *
IELTS Mentor "IELTS Preparation & Sample Answer"
- Skip to content
- Jump to main navigation and login
Nav view search
- IELTS Sample
- IELTS Line Graph
IELTS Academic writing task 1 - Line Graph

IELTS Materials
- IELTS Bar Graph
- IELTS Table Chart
- IELTS Flow Chart
- IELTS Pie Chart
- IELTS Letter Writing
- IELTS Essay
- Academic Reading
Useful Links
- IELTS Secrets
- Band Score Calculator
- Exam Specific Tips
- Useful Websites
- IELTS Preparation Tips
- Academic Reading Tips
- Academic Writing Tips
- GT Writing Tips
- Listening Tips
- Speaking Tips
- IELTS Grammar Review
- IELTS Vocabulary
- IELTS Cue Cards
- IELTS Life Skills
- Letter Types

- Privacy Policy
- Cookie Policy
- Copyright Notice
- HTML Sitemap

A common question type in IELTS academic writing task 1 is to describe a trend as shown on a line graph. In this article, I will teach you everything you need to know about describing trends in the past to get a high score for this question.
We can use this vocabulary in 3 main structures as follows.
Structure 1:
There was a + adjective + noun…
Eg. There was a rapid increase in the number of cars sold.
Structure 2:
The figure/number/amount/sales/exports/imports + verb + adverb…
Eg. The figure for cars sold increased rapidly.
Structure 3:
The figure/number/amount + experienced/witnessed + a + adjective + noun…
Eg. The number witnessed a rapid increase.
It is important to know how to use all of these structures accurately in order to avoid repetition. Look at below charts for examples of vocabulary that you can use to describe trends in IELTS writing task 1.
Let's take a look at some examples of how to use these structures to describe a line graph.
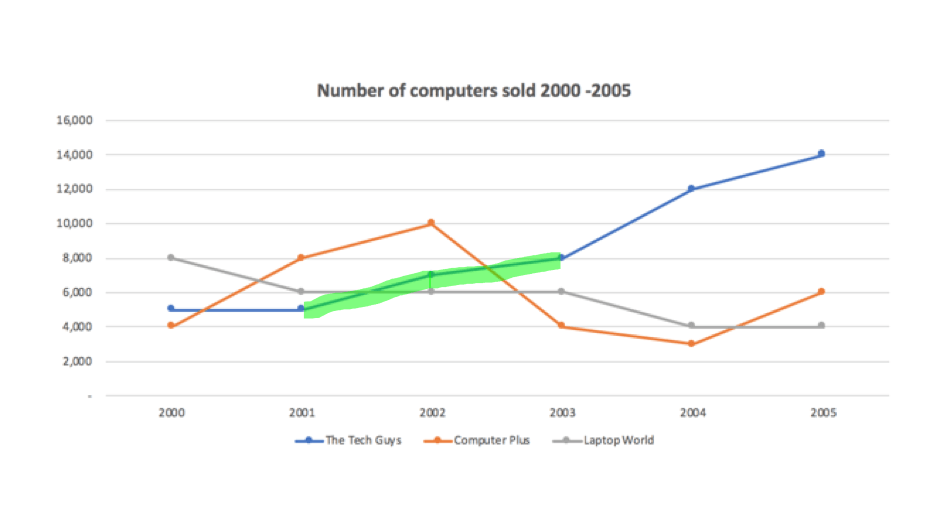
S1: There was a steady rise in the number of computers sold between 2001 and 2003.
S2: The figure increased steadily between from 2001 to 2003.
S3: The figure experienced/witnessed a steady increase between 2001 and 2003.New Paragraph
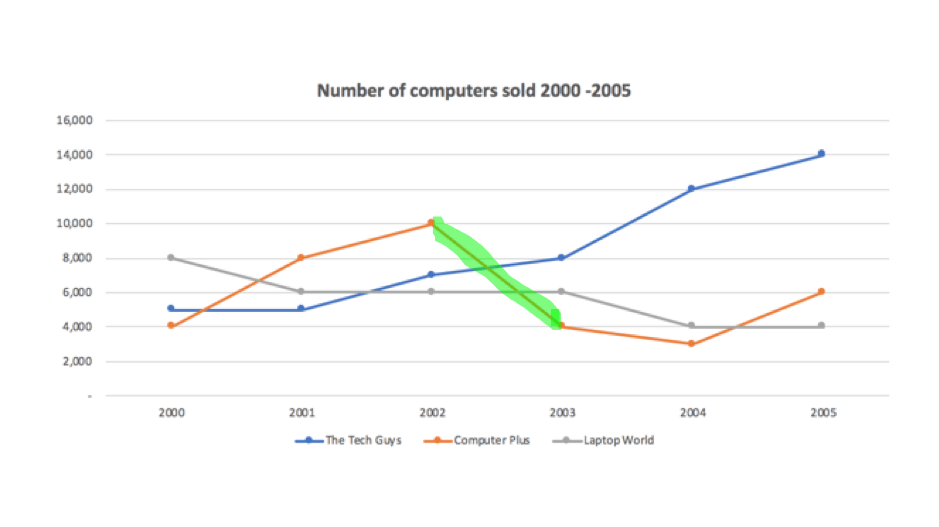
S1: There was a sharp decrease in the number of computers sold in 2003.
S2: The figure fell dramatically in 2003.
S3: The figure experienced/witnessed a rapid drop in 2003.
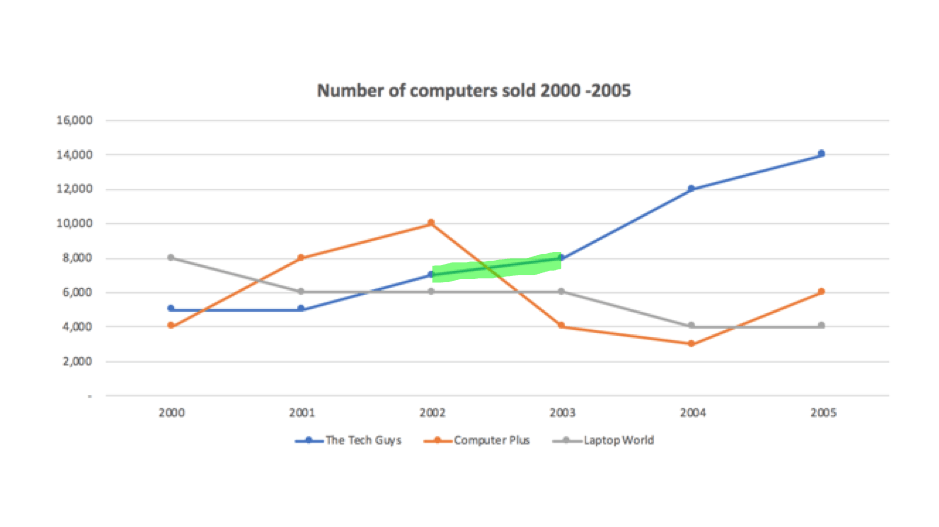
S1: There was a slight increase in the number of computers sold in 2003.
S2: The figure rose slightly in 2003.
S3: The figure experienced/witnessed a slight rise in 2003.
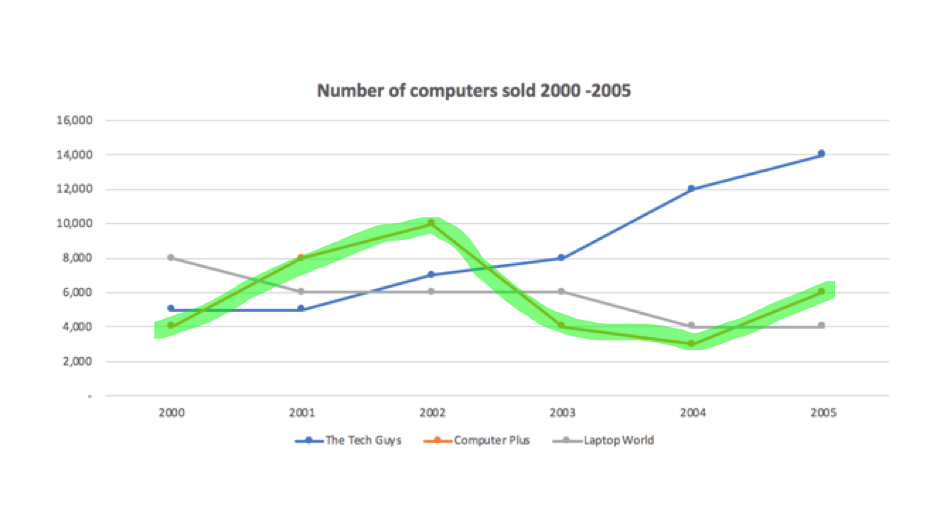
S1: There was a fluctuation in the number of computers sold in from 2000 to 2005.
S2: The figure fluctuated between 2000 and 2005.
S3: The figure experienced/witnessed a fluctuation between 2000 and 2003.
*Fluctuation/to fluctuate = to go up and down
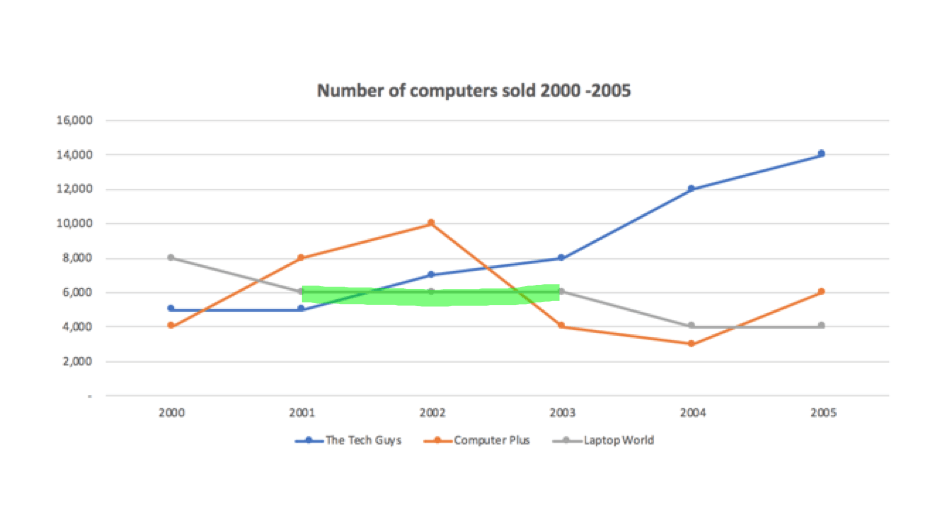
S1: The figure remained stable between 2001 and 2003.
S2: The figure remained unchanged from 2001 to 2003.
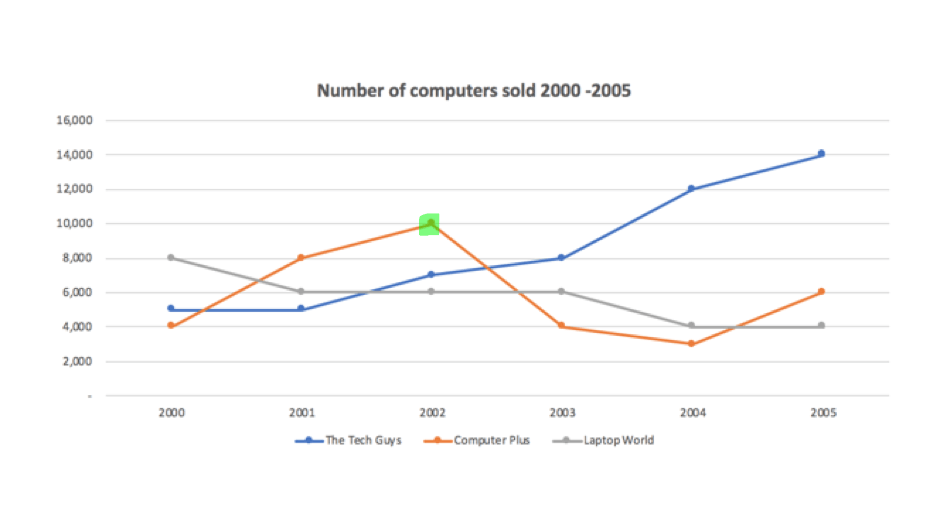
S1: The figure for Computer Plus reached a peak in 2002.
(a peak = its highest figure)
02 Structuring your trend report.
For this task, I recommend that you use 4 paragraphs that contain information as follows;
1. Introduction
- Paraphrase the question.
2. Overview
- Give summary of major movements.
- Mention highest and lowest and general direction of movement ie, increase/decrease/fluctuation.
- Do not include figures in this paragraph.
3. Detail paragraph 1
- Include figures.
- Use linking words to connect sentences. (We will look at this later in the lesson)
4. Detail paragraph 2
*There is no need to include a conclusion paragraph in IELTS writing task 1.
03 Exam step 1: Analyzing & Planning.
Before you plan, you need to analyze the question. Many students fail to do this and as a result make silly mistakes and lose easy marks for Task Achievement.
In this step, you should;
01 Read all parts/explanations of the diagram/chart to understand what you are looking at.
Many students fail to do this and as a result make silly mistakes and lose easy marks for Task Achievement.
02 Identify ‘key’ or interesting features.
For trends you should look at the chart or graph and take note of.
- Starting and finishing figures for each category/group.
- Major changes in direction.
- Large/dramatic movements.
- Highest/lowest figures.
For example.
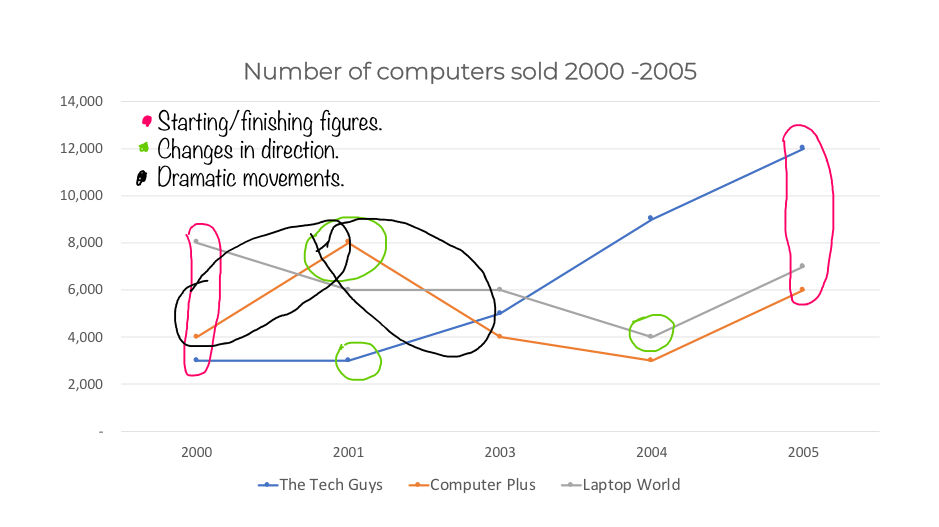
04 Exam step 2: Paraphrasing the question.
In order to get a high score in IELTS writing you must show the examiner your ability to paraphrase. You can use synonyms to paraphrase the question but make sure you are 100% correct. Many students paraphrase incorrectly making their writing difficult to understand and often inaccurate. You should not aim to use ‘high level’ words here. Simply, use synonyms and/or change the grammatical structure of the sentence.
Let’s take a look at an example of how we might do this.
Original question
The chart below shows the number of computers sold at three computer stores in Ho Chi Minh City between 2000 and 2005.
Introduction line (paraphrased question)
The line graph illustrates/depicts how many books were sold from 2000 to 2005 at three computer shops located in Ho Chi Minh City.
Below are some useful synonyms that you can use to paraphrase the question.
- Graph/Line graph/Chart/Table/Bar chart – Diagram
- Shows – illustrates – depicts
- The number of – how many
- The amount of – how much
- From 2000 to 2005 – between 2000 and 2005
- Shop – store
- In – located in
05 Exam step 3: Writing an overview.
The overview should come after the introduction line. In this paragraph, you should do the following.
- Give a summary of major movements.
- Mention highest and general direction of movements ie, increase/decrease/fluctuation.
*Do not include figures in this paragraph.
Take a look at the below example.

Overview Example
Overall, the figure at The Tech Guys rose steadily and accounted for the highest sales during the period, peaking in 2005. In contrast, sales at Laptop Plus, which had the lowest sales of the three stores, decreased considerably while figures at Computer Plus fluctuated over the period.
06 Exam step 4: Writing body paragraphs.
In order to get a high score in IELTS writing task 1 your writing needs to flow(progress naturally) and include some complex sentences. To create a flow in your report, you should use some linking words like ‘following this’ or ‘then’ to describe when something happened. You should also use linking words to compare like ‘similarly’ or ‘On the other hand’. If you’re not familiar with complex sentences, it is a good idea to check out our lesson on them here .
‘Before’ and ‘after’ are very useful for describing trends and along with some linking words can help you to group information and maintain a natural flow in your writing. Previously in this lesson, we looked at some vocabulary and structures to use.
Now take a look at the below examples in which I group information paying attention to the key or interesting features we identified in the analyzing and planning stage.
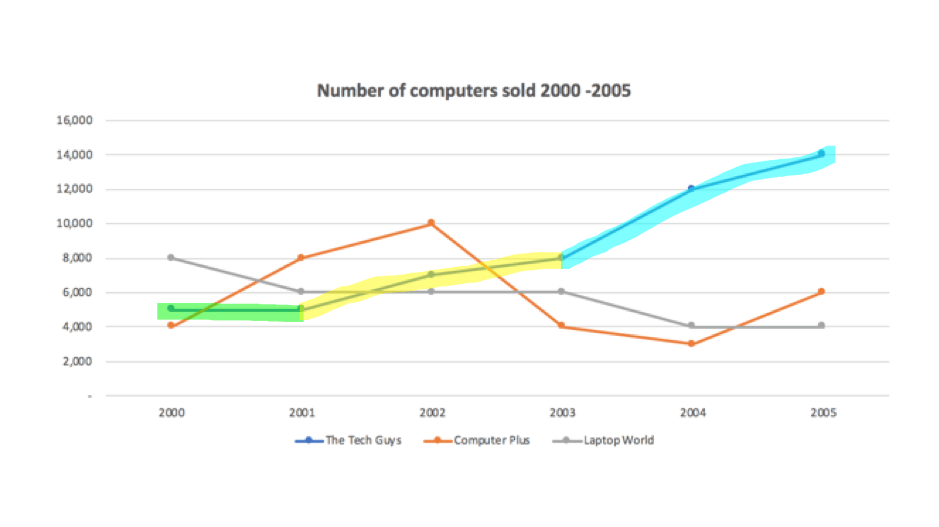
07 Sample Answer
Summarise the information by selecting and reporting the main features and make comparisons where relevant.
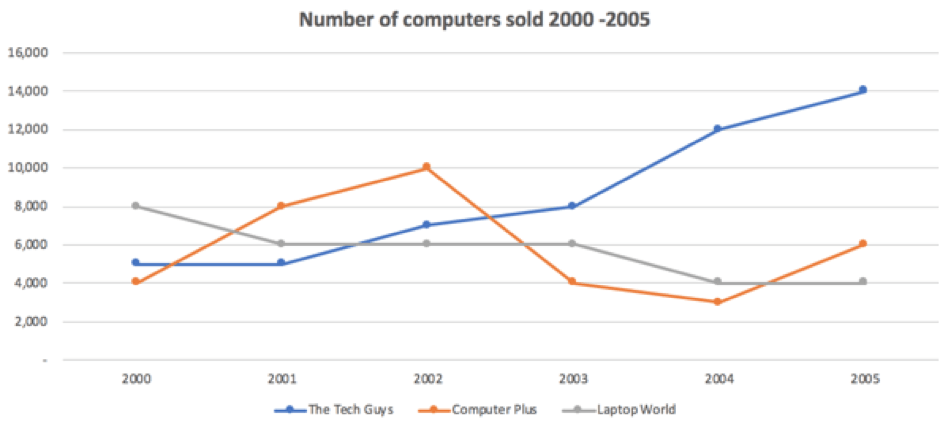
Sample Answer
Standing at about 5,000 in 2000, computer sales at The Tech Guys remained stable for the first year before increasing steadily to 8,000 in 2003. Following this, there was a considerable rise until the end of the period when it reached a peak of 14,000 units. Sales at Computer Plus grew significantly, from 4,000 units to 10,000, in the first 2 years of the period. The figure then fell dramatically to a low of about 3,000 before rising substantially in the final year to finish at 6,000 units.
On the other hand, the number of computers sold at Laptop World began at about 8,000, and dropped slightly in 2001 before remaining unchanged for the following 2 years. After witnessing another decrease in 2004, the figure levelled off and ended the period at 4,000 units.
(204 words)
I hope you found this useful for your IELTS preparation. If you any questions, please put them in the comments below. If you liked this lesson you can see more of our lessons a the link below. Don't forget to subscribe so that you don't miss out on new lessons!

Writing Lessons

Speaking Lessons
Want to get 6.5 or above?
Join our ielts speaking masterclass course.
IELTS Line Graph (Writing Task One Academic)
Line graphs are the most common IELTS academic task one question type. They can also be one of the hardest types to answer. On this page, you can check out my sample answer for an especially tricky line graph question and find out why it is worth a band nine.
IELTS Line Graph Band Nine Sample Answer
This question below is my band nine answer for a fairly famous task one question. Once you’ve finished, keep scrolling to find out why it would get a band nine and for some extra tips.
The graph below shows the population of India and China from the year 2000 to the present day with projections for growth to the year 2050. Summarise the information by selecting and reporting the main features, and make comparisons where relevant.

This graph demonstrates how the number of people in China and India have and will change over time. The graph starts with historical data going back to the year 2000 and continues with predictions up to 2050.
Overall, the population of India will overtake that of China in 2030 and continue to grow through to 2050. Meanwhile, China’s population will peak in the late 2020s before gradually declining.
At the beginning of the graph, in the year 2000, the population of China was 1.25 billion people. According to the graph, this has been growing and will continue to grow to a peak of just over 1.4 billion. After this time, the population will begin to steadily decline, reaching a low point of just under 1.4 billion by 2050.
On the other hand, the population of India has been increasing steadily since the year 2000 and will continue to grow into 2050. In the year 2000, the population of India was 1 billion, far lower than China’s. India’s population will overtake China’s in 2030 when both are just over 1.4 billion people. Its population will continue to grow to 1.6 billion in the year 2050, although this growth will become more gradual over time.
Why is this essay band nine?
At first glance, this looks like quite a hard line graph to write about. After all, you only have two lines to talk about, which means some test takers could run out of things to say. To make things worse, the tenses used to describe this graph are quite complex.
Using perfect continuous tense
When we want to describe something that has been happening non stop for an extended period of time and which are still happening now, we can use the present perfect continuous tense. We often use this tense with ‘for’ and ‘since’. For example:
- I have been living in London since 2020.
- They have been studying hard for the IELTS exam for a year.
- She has been watching that TV show for the last five hours.
To be honest, this is quite a rare tense, but it comes in handy for questions like this. In the essay, I’ve used it for:
- According to the graph, this has been growing and will continue to grow to a peak of just over 1.4 billion.
- On the other hand, the population of India has been increasing steadily since the year 2000 and will continue to grow into 2050.
For both of these sentences, I’ve combined the present continuous with the future tense. This is less clunky than something like ‘The population of India, has grown, is growing and will grow.’
Good Task One Structure
The structure of this answer is exactly how it should be. It has:
- An introduction telling you what the graph is about.
- An overview which gives the key points without going into detail or giving any numbers.
- Two body paragraphs both with a clearly defined topic.
Related posts
- IELTS Scores
- Life Skills Test
- Find a Test Centre
- Alternatives to IELTS
- General Training
- Academic Word List
- Topic Vocabulary
- Collocation
- Phrasal Verbs
- Writing eBooks
- Reading eBook
- All eBooks & Courses
- Sample Graphs
- Line Graph Examples
IELTS Line Graph Examples
Continuing with the sites IELTS line graph examples, this is an example of a line graph comparing car theft.
It's important to organise your graph clearly, draw out the key trends and make comparisons.
That has been done well in this answer.
You should spend about 20 minutes on this task.
The line graph shows thefts per thousand vehicles in four countries between 1990 and 1999.
Summarize the information by selecting and reporting the main features and make comparisons where relevant.
Write at least 150 words.

IELTS Line Graph Examples - Model Answer
The line graph compares the number of cars stolen for every 1000 vehicles in four countries from 1990 to 1999. Overall, it can be seen that car thefts were far higher in Great Britain than in the other three counties throughout the whole time frame.
To begin, car thefts in Sweden, France and Canada followed a fairly similar pattern over the first five years, all remaining at between 5 and 10 per thousand. The general trend though for France and Canada was a decline in the number of vehicles stolen over the period, with both at around 6 in 1999. In contrast, Sweden experienced an upward trend, starting the period at approximately 8, and finishing at just under 15.
Interestingly, car thefts in Great Britain started at 18 per thousand, which far exceeded that of the other countries. It then fluctuated over the next nine years, reaching a peak of 20 thefts per 1000 in 1996, and ending the period slightly lower than where it began, at approximately 17 per thousand.
(Words 174)
This graph would score highly in the IELTS test.
The graph starts with an overview that highlights the key information presented in the graph.
It has also been organised very clearly around the main trends.
The first body paragraph describes Sweden, France and Canada together as they follow a very similar pattern, whereas Great Britain is discussed separately in the second body paragraph as this follows a very different pattern.
This makes the description easy to follow and read and shows the writer has been able to make comparisons of the data.
There is also a good range of vocabulary and accurate grammar.
<<< Back
Next >>>
More on IELTS Line Graphs:

Line Graph Quiz
Line Graph Quiz: Have a go at this fun quiz to help you find out what you know about graphs and to help you improve your IELTS score.

IELTS Line Graph Sample Answer: Average carbon dioxide (Co2) emissions
View an IELTS line graph sample answer that would score highly in the exam. It's well organised and covers all the requirements of the task.

Tips for Organising an IELTS Line Graph
Organising an IELTS Line Graph - This lesson shows you have to improve the coherency of your graph in order to achieve a high band score.

IELTS Line Graph Worksheet: Practice the language of change
IELTS Line Graph Worksheet - this is a gap fill to help you practice the language of change for IELTS graphs over time.

IELTS Task 1 Line Graph Structure Using Groups
For an IELTS Task 1 Line Graph there are different ways to organise your answer. Grouping information is a good way to get a logically structured response.

IELTS Sample Line Graph
This is an IELTS Sample Line Graph with model answer that you can use to help you prepare to write your answer for a task 1 that describes changes over time.
Any comments or questions about this page or about IELTS? Post them here. Your email will not be published or shared.
Before you go...
Check out the ielts buddy band 7+ ebooks & courses.

Would you prefer to share this page with others by linking to it?
- Click on the HTML link code below.
- Copy and paste it, adding a note of your own, into your blog, a Web page, forums, a blog comment, your Facebook account, or anywhere that someone would find this page valuable.
Band 7+ eBooks
"I think these eBooks are FANTASTIC!!! I know that's not academic language, but it's the truth!"
Linda, from Italy, Scored Band 7.5

IELTS Modules:
Other resources:.
- All Lessons
- Band Score Calculator
- Writing Feedback
- Speaking Feedback
- Teacher Resources
- Free Downloads
- Recent Essay Exam Questions
- Books for IELTS Prep
- Useful Links

Recent Articles
Decreasing House Sizes Essay
Apr 06, 24 10:22 AM

Latest IELTS Writing Topics - Recent Exam Questions
Apr 04, 24 02:36 AM

IELTS Essay: English as a Global Language
Apr 03, 24 03:49 PM
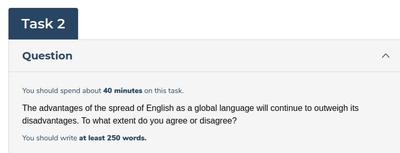
Important pages
IELTS Writing IELTS Speaking IELTS Listening IELTS Reading All Lessons Vocabulary Academic Task 1 Academic Task 2 Practice Tests
Connect with us
Copyright © 2022- IELTSbuddy All Rights Reserved
IELTS is a registered trademark of University of Cambridge, the British Council, and IDP Education Australia. This site and its owners are not affiliated, approved or endorsed by the University of Cambridge ESOL, the British Council, and IDP Education Australia.
IELTS Writing Task 1 – Line Graph Essay Example 2
In this post, we will look at a Writing Task 1 Academic line graph essay example from the IELTS writing task 1 Academic Test. Students often ask if the questions are repeated year after year and the answer is no, but the type of chart or graph can be.
There are so many questions written each year, you may find you practice answering various questions on different topics. It is best practice to learn how to answer each one of the various types of writing task 1 questions , from bar charts, line graphs, maps, process etc.
If you would like to learn how to structure a charts and graphs essay please click the button below >
Take a look at the IELTS Writing Task 1 Academic essay example below >>
*This line graph question and answer were provided by a student. IELTS Achieve did not design this question*
The graph gives information about the number of spreads (Margarine, low fat & reduced spread and butter) consumed from the year 1981 up to 2007. The units were measured in grams.
Overall, the highest consumed spread was butter which started as the most used among the three, whereas low fat and reduced spread were only introduced in 1996, however, all three spreads fluctuated within the end of the given time frame.
On the one hand, butter started strong with 140 grams consumed in the year 1981 but gradually decreased as the years progressed until it plummeted to nearly 50 grams used by 2007. Similarly, this can be seen in margarine with almost 90 grams used in 1981 then it slowly decreased in 1986. It reached a plateau in 1991 up to 1996 and gradually decreased reaching 40 grams used in 2007.
On the other hand, low fat & reduced spread was introduced in 1996. It gently rose from almost 10 grams used when it started then progressively increased reaching its highest peak in 2001 (80 grams) however like the two other spreads it slowly decreased up until 2007 were it garnered almost 60 grams.
Word count – 194 / Band score – 8

- Task Achievement – The answer provides a paraphrased question, to begin with, followed by an overview that gives the reader key information.
- Coherence and Cohesion – The answer has been divided into clear logical paragraphs.
- Lexical Resource – There is evidence of paraphrasing, synonyms and some less common words.
- Grammatical Range and Accuracy – The answer has no grammatical errors. The sentences are mainly made up of multiple clauses and have a variety of structures.
We hope you found this post useful in helping you to study for the IELTS Test . If you have any questions please let us know in the comments below or on the Facebook page.
The best way to keep up to date with posts like this is to like us on Facebook , then follow us on Instagram and Pinterest . If you need help preparing for the IELTS Test, join the IELTS Achieve Academy and see how we can assist you to achieve your desired band score. We offer an essay correction service, mock exams and online courses.
Related Posts

IELTS Writing Task 1 – Bar Chart Example Essay – 2
IELTS Writing Task 1 Academic bar chart essay example that is a band score 8.…
A few problems have emerged in your apartment: Semi-Formal Letter [IELTS General Writing Task 1 ]
You should spend about 20 minutes on this task. You have been living in an apartment for…
1 thought on “IELTS Writing Task 1 – Line Graph Essay Example 2”

Thanks for finally talking about >IELTS Writing Task 1 – Line Graph Essay Example 2 – IELTS ACHIEVE <Loved it!
Leave a Comment Cancel Reply
Your email address will not be published. Required fields are marked *
Save my name, email, and website in this browser for the next time I comment.
Hubert Butler Essay Prize announced
Books newsletter: borris and west cork festival line-ups; banagher brontë festival; open mic for gaza; write by the sea; john mcgahern exhibition; commonwealth and jhalak prizes.
:quality(70)/cloudfront-eu-central-1.images.arcpublishing.com/irishtimes/LHJA57WXBPAKMYPLFJRAIYQAQQ.jpg "line graph essay writing")
Hubert Butler: This year’s Butler essay prize theme is ‘With narratives of conflict currently distorted by misinformation and the substitution of memory for history, what are the chances of reconciliation?’. Photograph: Matt Kavanagh
:quality(70)/s3.amazonaws.com/arc-authors/irishtimes/f59da41d-80df-4aaa-a086-a7a7458a5268.png "line graph essay writing")
In The Irish Times this Saturday, Salman Rushdie talks to Keith Duggan about Knife, his memoir about surviving a vicious attempt on his life; Ingrid Persaud tells John Self about her new novel, The Lost Love Songs of Boysie Singh; Nuala O’Connor tells Niamh Donnelly about her latest novel, Seaborne. Peter Murtagh rode his motorbike through North and South America for his travel book, From Tip to Top, and never felt in need of a gun, but writes about how in Texas and Arizona he found intense pressure around the issue. Director Pat Collins discusses his award-winning adaptation of John McGahern’s final novel with Donald Clarke; and there is a Q&A with Leeanne O’Donnell, author of Sparks of Bright Matter.
Reviews are Paul Gillespie on Circle of Stars, A History of the EU and the People Who Made It by Dermot Hodson and Nationalism in Internationalism: Ireland’s Relationship with the EU by by Michael Holmes and Kathryn Simpson; Houman Barekat on Knife: Meditations after an Attempted Murder by Salman Rushdie; Neil Hegarty on Paul Carlucci’s The Voyageur; Declan Burke on the best new crime fiction; Mia Levitin on Choice by Neel Mukherjee; Jessica Traynor on Weathering by Ruth Allen; Chris Cusack on The Axeman’s Cardinal by Catherine Chidgey; Gráinne Lyons on From Tip to Top: The Journey of a Lifetime, From Chile to Alaska by Peter Murtagh; Nadine O’Regan on The Amendments by Niamh Mulvey; Pat Carty on Nuclear War by Annie Jacobsen; Niamh Donnelly on Maggie Armstrong’s Old Romantics; and Sarah Gilmartin on You Are Here by David Nicholls.
This week’s Irish Times Eason offer is Someone Else’s Shoes by Jojo Moyes. You can buy it with your newspaper for just €5.99, a €5 saving.
:quality(70)/cloudfront-eu-central-1.images.arcpublishing.com/irishtimes/RIYXIKWDJNAAFLXOB54SV26IRA.jpg "line graph essay writing")
Eason offer
The Hubert Butler Essay Prize is in its seventh year. Over a period ominously racked by global crisis and conflict, the prize has focussed attention on themes and issues which are central both to Butler’s work, and the world today - such as frontiers, identity, the abuse of political power, coping with the pandemic, and the tension between individual and community values.
This year’s theme is ‘With narratives of conflict currently distorted by misinformation and the substitution of memory for history, what are the chances of reconciliation?’
We wanted to encourage examination of the uses and abuses of history, at a time when deep-rooted antagonisms all round us have taken a particularly toxic form, and also to consider the implications of the tendency to discount ‘history’ in favour of ‘memory’. Butler’s commitment to clarity of thought and his determination to face up to uncomfortable truths has never been more acutely needed, and the essay form - as he showed so consummately - remains uniquely suited for projecting this essential endeavour.
First prize is €1,500 and there are two second prizes of €500. The judges are Roy Foster (chair), Barbara Schwepcke, Catriona Crowe and Nicky Grene. Closing date is June 29th. The winner will be announced on 13th August at a prize giving in Kilkenny, presented by Olivia O’Leary. Entry details here: hubertbutleressayprize.com
The Borris House Festival of Writing & Ideas, which takes place from June 7th to 9th, has launched its schedule. Final tickets are on sale for Friday and Sunday, while Saturday and Weekend tickets have already sold out. festivalofwritingandideas.com
Borris, Co Carlow is home to this annual gathering of writers from all over the world - approximately 80 in total - and the event now features performances of theatre and music as well as its unique and bespoke curated encounters between writers.
Among this year’s big names are Margaret Atwood, Elizabeth Strout, Minnie Driver, Ocean Vuong, Adam Clayton, Jon Ronson, Nick Broomfield, Cerys Matthews, Ruby Wax, Sebastian Barry, Kevin Barry, Lemn Sissay, Peter Francopan, Deborah Levy, Fintan O’Toole, Ciarán Hinds, Neil Jordan, Sinead Gleeson, Emma Dabiri, Anne Enright, Orla Guerin, Fergal Keane, Annie Mac, David O’Doherty, OIivia O’Leary, Anthony Horowitz, Liz Nugent, Roy Foster, Colm Toibin, Misha Glenny, Louise Kennedy, Dylan Moran, Claire Kilroy, Mikel Murfi and Ye Vagabonds.
In a new departure this year, there will be an event on Sunday, June 9th in Dublin, at the Bord Gáis Energy Theatre: Margaret Atwood with special guests musician Laurie Anderson, climate activist and Chair of the Elders Mary Robinson, hosted by broadcaster and writer John Kelly. bordgaisenergytheatre.ie
The West Cork Literary Festival, an eight-day celebration of writing and reading, takes place in and around Bantry from July 12th to 19th. There are master classes, readings, and workshops, as well as interviews with authors, book launches and other events.
Writers taking part this year include Anne Enright, Colm Tóibín, Adania Shibli, David Nicholls, Dolly Alderton, Paul Lynch, Rónán Hession, Eimear Ryan, Theo Dorgan, Andrea Mara, Irvine Welsh, Miriam Margoyles, Elizabeth Day, Caleb Azumah Nelson and Jason Allen-Paisant.
“We have just announced this year’s line-up and we’re delighted by the response so far and by the excitement generated,” said festival director Eimear O’Herlihy. “It feels like West Cork Literary Festival is becoming a destination festival because what could be better than a week in Bantry in the summer with friends, writers and exciting and inspiring conversations happening on stages and in cafes all over town?” Booking for all events is now open on westcorkmusic.ie/LFprogramme or 027 527 88.
The Inaugural Banagher Brontë Festival will be held from this Friday to Sunday, April 19th-21st.
The weekend will open on Friday at 7pm with a premiere of An Evening with Charlotte Brontë devised specifically for the Banagher Brontë Group by Michael and Christine O’Dowd.
All events on Saturday will be held in Crank House starting at 11am with Joanne Wilcock’s talk, Falling in Love with Arthur. Joanne will explore the different opinions and feelings people have had about Charlotte Brontë's husband, Arthur Bell Nicholls.
At midday, Brontë scholar, Pauline Clooney (author of Charlotte & Arthur) will present Currer Bell’s Silent Years 1852-1855, an examination of Charlotte Brontë's paths to publication and her attitude to a writing life, and how, consequently, this attitude illuminates her creative silence from 1852 until her death in 1855.
At 2.30 p.m. Dr. Maebh O’Regan will present The Art of Branwell Brontë. From their earliest years the Brontës were passionate about art and were particularly inspired by the wood engravings of Thomas Bewick.
Further enquiries to James Scully on 085 710 7569 or banagherbrontegroup.com
:quality(70)/cloudfront-eu-central-1.images.arcpublishing.com/irishtimes/BRJ3DBKMBZAJ5JTEBRXNNFBXUM.png "line graph essay writing")
Open Mic for Gaza
Open Mic for Gaza will be held again on Global Pay It Forward Day, Sunday, April 28th. The online fundraiser will run on Zoom from 7pm-9 pm, featuring a wonderful line-up of special guests including |Michelle Gallen, Catherine Dunne and Juliana Adelman along with 15 open mic readers/performers. All funds raised will go to the Ghassan Abu Sittah Children’s Fund . You can register, donate, and express interest in an open mic slot here .
Write By The Sea, a boutique literary festival held annually in Kilmore Quay, Co Wexford, has secured a publishing partnership with Waterford-based literary journal, The Waxed Lemon.
The four category winners of the 2024 Write By The Sea writing competition will have their work published in the Winter 2024 edition of The Waxed Lemon. Each winner will also receive a prize of €500, plus a free weekend ticket to Write By The Sea festival. Second-place winners in each of the four categories will receive a cash prize of €300 and third-place winners will receive €200. Writers can submit their work now until June 21st via writebythesea.ie/writing-competition/
Joanne McCarthy of The Waxed Lemon said: “Nothing beats seeing your work in print. Write by the Sea is one of Ireland’s most respected literary festivals and we’re really delighted to be joining the judging panel and to be printing the winning entries.”
:quality(70)/cloudfront-eu-central-1.images.arcpublishing.com/irishtimes/A4F2MRRG5VCYBA57I3VYXL4NP4.jpg "line graph essay writing")
A Deep Well of Want
A Deep Well of Want: Photographs and Archives of McGahern Country, a new exhibition of photographs by Paul Butler, documents the landscape and passing rural life of Co. Leitrim and surrounding areas – the hinterland of writer John McGahern. It opens as part of Cúirt Festival on April 24th at 4pm-5pm in Room G10, Hardiman Building, University of Galway, with a Q&A discussion with the curators, moderated by Prof Tom Inglis (McGahern Barracks Museum).
Accompanied by archives and literary manuscripts from the John McGahern Archive, held at University of Galway Library, curated by Dr. Barry Houlihan, this exhibition presents a visual and documentary journey through McGahern Country – to the sites, places, words, and ideas that formed a wellspring for the literary imagination of John McGahern.
Opening as part of Cúirt Festival of Literature, the exhibition represents the largest display of manuscripts and materials from the McGahern archive. Combined with the beautifully captured and evocative photographs by Paul Butler, the exhibition is a unique opportunity to explore the visual and the written landscapes of McGahern and of Co. Leitrim.
Twenty-three writers from 13 countries have been shortlisted for the world’s most global literature prize – the Commonwealth Short Story Prize. Writers from three Commonwealth countries – Mauritius, Rwanda and St Kitts and Nevis – have been shortlisted for the first time. The prize is viewed worldwide as a bellwether of new talent and many nominated writers go on to find publishers, agents and other opportunities. Previous regional and overall winners include Sharma Taylor, Kevin Jared Hosein (both from the Caribbean) and Fijian writer Mary Rokonadravu – and this year’s themes are also interesting. One features a young person contemplating gender transition, a quarter are meditations on motherhood, and there are many speculative fiction stories. Five regional winners (for the five regions of the commonwealth) will be announced on 29 May and the overall winner on 26 June.
The Jhalak Prize and Jhalak Children’s & Young Adult Prize 2024 shortlists have been announced. The Jhalak Prize shortlist features exhilarating fiction, a raw snapshot of contemporary multicultural London, beguiling non-fiction about landscape and the natural world, an audacious true crime tale and an award-winning poet.
The Jhalak Children’s and Young Adult Prize shortlist features thought-provoking young fiction, vividly illustrated picture books, a YA thriller and an assured debut for middle grade readers. As with previous years, the shortlists demonstrate the exceptional quality and breadth of work produced by writers of colour, from the UK and Ireland today.
Prize director Sunny Singh said: “Every year, the Jhalak Prize shortlists exemplify literary excellence in contemporary Britain and mark them as future classics. I am in awe of the courage required to tackle difficult themes and ideas coupled with the command of the chosen genre and form demonstrated by our shortlistees. These are books about belonging and its price, about confronting injustice with hope, and about the audacity of trying even in the face of impossible odds. Most of all, these are books about moral courage, which makes the books on our 2024 shortlists necessary, urgent and timeless.”
The shortlist for the Jhalak Prize is: A Flat Place, Noreen Masud; Anansi’s Gold: The Man Who Swindled The World, Yepoka Yeebo; Boundary Road, Ami Rao; Fire Rush, Jacqueline Crooks; Self-Portrait As Othello, Jason Allen-Paisant; Twelve Words For Moss, Elizabeth-Jane Burnett. The 2024 shortlist for the Jhalak Children’s & Young Adult Prize is: Geoffrey Gets the Jitters, Nadia Shireen; How to Die Famous, Benjamin Dean; Safiyyah’s War, Hiba Noor Khan; Steady for This, Nathanael Lessore; To The Other Side, Erika Meza; and Wild Song, Candy Gourlay.
The two winners will be announced at the British Library on May 30th. Each winner will be awarded £1,000 and a specially created work of art as part of the ongoing Jhalak Art Residency.
IN THIS SECTION
Knife by salman rushdie review: living to tell the tale of being saved by love, impossible city: paris in the twenty-first century – a place like no other, cork world book fest turns 20, hagstone by sinéad gleeson: there is a lyricism to this magical and otherworldly debut novel, woman living ‘exotic’ lifestyle given four months to vacate home bought with crime proceeds, family affairs: how ireland’s newly rich are putting money to work in secretive firms, stardust inquests: families call for state apology as jury returns unlawful killing verdicts in each of the 48 cases, university changes gender identity policy that said refusal to use pronouns was ‘unlawful’, man convicted of operating ‘dodgy box’ service remanded in custody.
:quality(70)/cloudfront-eu-central-1.images.arcpublishing.com/sandbox.irishtimes/2RXL6SYZVZCZFBDMDTNTNY33HA.png "line graph essay writing")
- Terms & Conditions
- Privacy Policy
- Cookie Information
- Cookie Settings
- Community Standards
IMAGES
VIDEO
COMMENTS
IELTS Line Graph Essay. Here is the 5 steps process I recommend for planning and writing IELTS line graph essays: 1) Analyse the question. 2) Identify the main features. 3) Write an introduction. 4) Write an overview. 5) Write the details paragraphs. I'm going to take you through the whole process step-by-step as we work on a practice ...
The graph below shows how people buy music. Summarise the information by selecting and reporting the main features, and make comparisons where relevant. The graph illustrates trends in music buying habits between 2011 and 2018. It presents three different methods: streaming, downloading and buying CDs. Overall, both downloads and physical sales ...
IELTS-5 Writing Task-1. The line graph illustrates the trend of old people (≥65years) living in Japan, Sweden and USA over a century starting from 1940. Overall, it is evident that initially USA had the highest number of people aging 60 and above, followed by Sweden and then Japan. Supposedly, in 2040 Japan will come on the top.
Tips for IELTS Writing Task 1 Line Graph 2022. In the introduction part, you can paraphrase the question asked or the topic of the essay. When you explain the overall trend, identify the main feature and explain it. Ensure that each paragraph has examples that are percentages or numbers to support the sentence written as an explanation.
Structure of the IELTS Academic Writing Line graph. The structure of your IELTS Task 1 line graph typically consists of the following components -. Introduction - Provide a brief overview of the graph's subject, including the timeframe and data sources.. Overview - Summarise the main trends or patterns evident in the line bar graph.Mention the highest and lowest points, significant increases ...
By following these steps and incorporating these tips for How To Write a Line Graph Essay, you'll be well on your way to writing compelling line graph essays that demonstrate your analytical and communication skills. Remember, practice makes perfect! The more you analyze line graphs and write about them, the more confident you'll become.
A procedure to write an answer in line graph essay, first of all, you need to understand the graph and its trends. Note all key features and ups and downs very well. Write main trends in overview. The structure for IELTS writing task 1 line graph is simple as the introduction, overview, body paragraph 1 and body paragraph 2. In the body ...
If the line graph contains many lines and a lot of movement, be selective. You are being marked on your ability to select key features. Don't spend more than 20 mins on task 1. You will need a full 40 mins for task 2. Write 150 words or more. Aim for about 160-190 words. Don't write under the word count.
IELTS Writing Task 1 Academic line graph essay example that is a band score 8. The question is > The line graph below shows changes in the amount and type of fast food consumed by Australian teenagers from 1975 to 2000. Take a look at the sample answer >>
To make the best use of your time it's important to write with a clear structure, focus on the most important trend or trends, choose appropriate vocabulary and avoid common mistakes. In this tutorial, we have a band range 6.5 / 7 academic task 1 IELTS line graph example essay graded by an ex-IELTS examiner (on our team of essay correctors).
Writing task 1 line graph model answer. The graph illustrates comparative statistics on the number of burglaries in four countries (Great Britain, Greece, Spain and Norway) over a 10-year period (2000-2009). The units of thefts were measured in thousands. Overall, the highest recurrence of burglary was in Great Britain, which was fairly high ...
Also Read : 9 Practical IELTS Letter Writing Tips: Guide to General & Academic Writing. IELTS Writing Task 1 Line Graph Example Essay Question. Source: Cambridge English IELTS Past Papers. The IELTS writing task 1 line graph gives information from a 2008 report about the consumption of energy in the USA since 1980 with projections until 2030.
1. Analyze the question. It is the first step to framing your answer in the IELTS Writing task1 Academics. Read the question; understand the type of question, figures, and axis to frame your answers. 2. Identify the main features. For distinguishing the theme and the context, you need to identify the main features in the graph question.
on. March 22, 2021. in. IELTS Academic Writing Task 1. On IELTS test day, you may encounter line graphs in the Academic Writing Task 1 section. To help you understand what components make up a good response to a line graph question, let's take a look at a model band 9 essay. To see why this essay is band 9, see our scorer commentary after the ...
In task 1 of the IELTS writing test, you could be asked to describe a line graph. ... For example, my first line for this essay will be: The line graph shows information about sales in an unnamed bakery in the year 2014. Speaking of paraphrasing, you should also not include any reference to "below." Whilst the task description is above the ...
Using IELTS Graph Vocabulary in a Model Essay. Look at the sample IELTS writing Task 1 graphs on the British Council website. Below is my model answer with useful words in bold: The bar charts illustrate the trends in computer ownership, with a further classification by level of education, from 2002 to 2010.
Introduce the Graph. You need to begin with one or two sentences that state what the IELTS writing task 1 shows. To do this, paraphrase the title of the graph, making sure you put in a time frame if there is one. Here is an example for the above line graph: The line graph compares the fast food consumption of teenagers in Australia between 1975 ...
IELTS Academic writing task 1 - Line Graph. A line graph (also known as line chart) is a graphical presentation of data that changes over time. It uses line segments to connect data points and shows changes in data. The X and Y axis are used to denote the changes in the data. Within a line graph, there are points which are connected to show the ...
How to Tackle Line Graphs in IELTS Writing Task 1 Questions. In a line graph, there are usually multiple lines that show changes over time. In your writing, you need to group information based on lines having similar trends or values, so your essay structure will be as follows: Introduction: Paraphrase the question; Overview: Describe the ...
IELTS Writing Task 1: Line Graph. A common question type in IELTS academic writing task 1 is to describe a trend as shown on a line graph. In this article, I will teach you everything you need to know about describing trends in the past to get a high score for this question. My examples will be focused on describing trends in past.
IELTS Line Graph Band Nine Sample Answer. This question below is my band nine answer for a fairly famous task one question. Once you've finished, keep scrolling to find out why it would get a band nine and for some extra tips. The graph below shows the population of India and China from the year 2000 to the present day with projections for ...
The line graph shows thefts per thousand vehicles in four countries between 1990 and 1999. ... In this decreasing house sizes essay for IELTS you have to discuss the pros and cons of smaller house sizes and gardens. Read More. Latest IELTS Writing Topics - Recent Exam Questions. Apr 04, 24 02:36 AM. See the latest IELTS writing topics from the ...
Take a look at the IELTS Writing Task 1 Academic essay example below >>. *This line graph question and answer were provided by a student. IELTS Achieve did not design this question*. The graph gives information about the number of spreads (Margarine, low fat & reduced spread and butter) consumed from the year 1981 up to 2007.
The West Cork Literary Festival, an eight-day celebration of writing and reading, takes place in and around Bantry from July 12th to 19th. There are master classes, readings, and workshops, as ...