Want to create or adapt books like this? Learn more about how Pressbooks supports open publishing practices.

10 The IE Approach
Chapter table of contents, process improvement, pdca and dmaic tools.
How does an IE create a process to reliably produce a product or service with specified requirements? While the definition of industrial engineering says “the design or improvement” of a system, most IEs are involved in improvement. The IE approach is to continually improve the system.
In Good to Great [1] , Jim Collins found a focus on continuous improvement in the companies he studied: “Visionary companies focus primarily on beating themselves. Success and beating competitors comes to the visionary companies not so much as the end goal, but as a residual result of relentlessly asking the question ‘How can we improve ourselves to do better tomorrow than we did today?’ And they have asked this question day in and day out – as a disciplined way of life – in some cases for over 150 years. Nomatter how much they achieve – no matter how far in front of their competitors they pull – they never think they’ve done ‘good enough.'”
Improving the whole system at once is hard, so the IE focuses on a particular process in the production system. A process can be described as any activity or group of activities that takes an input, adds value to it, and provides an output to an internal or external customer.
Plan-Do-Check-Act (PDCA) and Define-Measure-Analyze-Improve-Control (DMAIC) are two acronyms indicating the steps an IE does to improve a process in a production system.
PDCA stands for Plan, Do, Check, and Act. The steps were developed by Shewhart and popularized by Deming; they are sometimes called the Shewhart Cycle .
- Plan – Ask and answer the following questions. What data do we have to help us plan improvements? What part of the organization should we work on next? Where do we have the biggest problems? Where do we think we can make the biggest improvement? What improvements could we make? What experiments could we do to get us data to evaluate proposed improvements? How would we analyze those data?
- Do – Carry out the planned experiments to test the various proposed improvements.
- Check – Observe the effects of the experiments. Analyze the data from the experiments. Decide which improvements, if any, should be implemented.
- Act – Reflect on what was learned. Implement the improvements that have been shown to be effective, or repeat the cycle focusing on specific improvements that show promise but need more refinement.
When you are done with PDCA, you do it again. Or, in other words, you are never done because you must practice continuous quality improvements. The American Society for Quality has a good summary of the steps and a links to a three-part webcast series that may be interesting to you.
DMAIC stands for Define, Measure, Analyze, Improve, and Control.
- Define – Select a process for improvement. The project champion assigns a project team and give them a project charter. Develop a preliminary process map. Use the Voice of the Customer to determine real requirements.
- Measure – Determine the current status of the process. Determine performance measures. Identify the gap between current status and desired status. Identify the critical process inputs (the Xs) and critical process outputs (the Ys). Develop a detailed process map. Determine possible root causes for the problems.
- Analyze – Evaluate the contributions of various possible root causes. The emphasis is on rigorous analysis of data.
- Improve – Test possible improvements through designed experiments. Develop an implementation plan for the ones that are shown to best meet the project objectives.
- Control – The project champion carries out the implementation plan. Sustain the improvement by training workers and by implementing control charts. As with PDCA, when you are done DMAIC, you do it again.
Process Redesign to Reduce Cycle Time, by D. Bandyopadhyay, describes an example.
PCDA, DMAIC, and other versions all have in common these important features:
- Make sure you are solving an important problem.
- Use a team to generate ideas because a group of people can generate more ideas than any one individual.
- Use facts, experiments, and data for decision making.
- Continuously improve quality.
PDCA and DMAIC are very similar, but have some differences. Since it is sometimes called the Shewhart Cycle , PDCA emphasizes more the need to repeat the steps, while DMAIC adds the Control step lacking in PDCA.
Both PDCA and DMAIC use these tools:
- Documentation
- Process flow diagram or flowchart
- Check sheet
- Pareto chart
- Brainstorming and Nominal Group Technique
- Defect concentration chart
- Cause and effect diagram or fishbone diagram
- The five whys and root cause analysis
- Regression analysis
- Design of experiments and analysis of variance
- Control charts
Teams . Continuous improvement of a process requires the involvement of everyone who works on that process. A team is usually created to focus on a particular problem or a particular process, but may include people who work in the processes that provide input or receive the output from the process being studied. For example, a team to improve the process of moving patients from the Emergency Department to a hospital room should include people who move the patients, but should also include people who work in the Emergency Department as well as people who work in the hospital. Team members may need training in some of the tools described below and support from staff people for data analysis.
Documentation . According to Robitaille (page 65):“If the documents aren’t correct, the system will always have problems.”

Check sheet . An important type of documentation is to routinely record all exceptions and problems. Each instance of a problem may seem to be isolated, but analysis of such data may turn up problems that should be studied and fixed. A check sheet is a simple chart allowing workers to put a check mark next to the type of problem that has occurred, or to record by hand a problem that does not fit into the types listed. This example of a check sheet used to record the reason for telephone interruptions is a useful resource.
Histogram . Categorical data such as data recorded in a check sheet can be displayed in a histogram. The relative number of different types of problems is easier to see in such a visual display. Here is a video from the Khan Academy explaining how to develop a histogram.
Pareto chart . A Pareto chart is a special type of histogram in which the categories are listed from most frequent to less frequent. The following Pareto chart from Parkview Hospital shows the causes for a delay in moving a patient from the Emergency Department to a hospital bed.

Putting the items in order by frequency means that the biggest cause is listed first; that cause is usually the one that should be focused on first. If you can fix the biggest causes, then you will have eliminated a large proportion of the defects.
The Pareto principle (named after economist Vilfredo Pareto, but generalized by J. M. Juran) is also sometimes called the 80-20 principle. Juran wrote: “Managers are well aware that the numerous situations and problems they face are unequal in importance. In marketing, 20% of the customers (the ‘key’ customers) account for over 80% of the sales. In purchasing, a few percent of the purchase orders account for the bulk of the dollars of purchase. In personnel relations, a few percent of the employees account for most of the absenteeism. in inventory control, a few percent of the catalog items account for most of the dollar inventory. In cost analysis, roughly 20% of the parts contain 80% of the factory costs; the basic function of a product accounts for 80% of the cost, while the secondary functions account for only 20% of the cost. In quality control, the bulk of the field failures, downtime, shop scrap, rework, sorting, and other quality costs are traceable to a vital few field failure modes, shop defects, products, components, processes, vendors, designs, etc.”
Figure 10.2 shows Parkland Hospital had 9 causes for delay; 20% of 9 is 1.8 or about 2. The largest 2 causes (Bed and Report) account for only 56.7% of the problems, so we can see that the Pareto rule doesn’t always hold. It is, however, often a useful guideline.
Defect concentration chart . Sometimes defects or other problems can be recorded or displayed according to location. For example, breakdowns of machines can be displayed on a map of a factory to determine if the breakdowns are occurring in a particular area. Defects in welds on a product can be displayed on a diagram of the product to see if the weld defects are concentrated in a particular part of the product. You can see an example of how concentration diagrams are used here.
Brainstorming and Nominal Group Technique . Usually everyone on the team has ideas about why the problem is occurring. However, a good process should be used to develop a list of possible causes to avoid the team from focusing too early on just a few causes. Team brainstorming usually works best with these steps:
- Clear statement of the problem or issue for which ideas are being generated. For example, generate possible causes why customers sometimes receive shipments that are missing items.
- Silent generation of ideas by each individual, writing on paper.
- Round robin collection of ideas, recorded on a board or flip chart visible to all. Each person gives one idea during each round, and can “pass” during any round. During this step, ideas are not evaluated. The more ideas and the more different the ideas, the better. After a round in which all pass, some time should be allowed for all to think a bit more. The facilitator should be sure to encourage everyone to volunteer all the items generated during the silent generation. Sometimes people are hesitant to volunteer ideas that differ from what others have said, but one of the values of working in a team is the generation of different types of ideas.
- Clarification and combination of ideas. Often some ideas are similar in concept, but different in wording. The team works together to clarify and combine ideas. Ideas should not be overly combined; if the person who volunteered an idea wants to keep an idea separate, the team should usually defer to that person.
- Prioritization among the ideas. This step is not always appropriate. If the team is brainstorming causes for a problem, data, not voting, should usually be used to determine which causes are more important. If the team is brainstorming ideas for next steps for the improvement, prioritization is needed. If there are 10 or few items, each team member can rank order the items (from 10 for the highest priority to 1 for the lowest) and the sum is used to prioritize. If there are more items, voting can be used to first reduce the list. For example, each person is given a number of votes equal to half the number of items. Each person allocates votes; votes can be allocated all to one item (expressing a strong preference), or allocated among items. Sometimes colored dots or colored pens are used, so the team’s preferences are visible and can be discussed.
Cause and effect diagram or fishbone diagram . Often causes can be grouped into overall categories such as people, equipment, methods, and materials. The figure below includes those labels on what are called the major bones of the fishbone, with more specific ideas categorized under those labels. Smaller lines can be included as needed.

The five whys and root cause analysis . Root cause analysis (RCA) is an in-depth investigation into the cause or causes of an identified problem, a customer complaint, a nonconformance, the nonfulfillment of a requirement, or an undesirable condition. The goals are:
- to determine why the situation occurred, tracing back in time through previous steps in the process, and
- to prevent the situation from occurring again.
The goal is not to blame a person, but to fix the system. One approach is to continue to ask “why” at least five times. An IE keeps asking “why?” until the root cause is identified for a problem:
- Because the wrong shipping label was put on the customer’s shipment.
- Because some shipments were removed from the shipping department.
- Because the customer had made some last minute changes to the order.
- And so forth.
Regression analysis . A scatter diagram shows the effect of only one variable on the variable we are studying. More sophisticated analysis allows for more independent or explanatory variables. With more variables, plots cannot be used, but the mathematical techniques of regression analysis can indicate which variables are most important in explaining the variation in the dependent variable, that is, the variable being studied.
Design of experiments and analysis of variance . After careful analysis of data, a team may have some good ideas about why the problem is occurring and may have some good ideas about how to fix the problem. A carefully designed experiment can test these ideas. The analysis of variance (ANOVA) is a mathematical technique (like regression analysis) for determining which variables have the most effect on the variable being studie.
Control charts . Key measurements of a process should be monitored to make sure that the process is functioning within the required limits. The design and use of control charts requires mathematical analysis to distinguish natural variation in the system from clear indications that the process has changed.
- Collins, J. C. (2001). Good to great: Why some companies make the leap ... and others don't. New York, NY: HarperBusiness. ↵
Introduction to Industrial Engineering Copyright © 2020 by Bonnie Boardman is licensed under a Creative Commons Attribution 4.0 International License , except where otherwise noted.
Share This Book
By using this site you agree to our use of cookies. Please refer to our privacy policy for more information. Close
7 Powerful Problem-Solving Root Cause Analysis Tools
The first step to solving a problem is to define the problem precisely. It is the heart of problem-solving.
Root cause analysis is the second important element of problem-solving in quality management. The reason is if you don't know what the problem is, you can never solve the exact problem that is hurting the quality.

Manufacturers have a variety of problem-solving tools at hand. However, they need to know when to use which tool in a manner that is appropriate for the situation. In this article, we discuss 7 tools including:
- The Ishikawa Fishbone Diagram (IFD)
- Pareto Chart
- Failure Mode and Effects Analysis (FMEA)
- Scatter Diagram
- Affinity Diagram
- Fault Tree Analysis (FTA)
1. The Ishikawa Fishbone Diagram IFD

The model introduced by Ishikawa (also known as the fishbone diagram) is considered one of the most robust methods for conducting root cause analysis. This model uses the assessment of the 6Ms as a methodology for identifying the true or most probable root cause to determine corrective and preventive actions. The 6Ms include:
- Measurement,
- Mother Nature- i.e., Environment
Related Training: Fishbone Diagramming
2. Pareto Chart

The Pareto Chart is a series of bars whose heights reflect the frequency or impact of problems. On the Chart, bars are arranged in descending order of height from left to right, which means the categories represented by the tall bars on the left are relatively more frequent than those on the right.
Related Training: EFFECTIVE INVESTIGATIONS AND CORRECTIVE ACTIONS (CAPA) Establishing and resolving the root causes of deviations, problems and failures
This model uses the 5 Why by asking why 5 times to find the root cause of the problem. It generally takes five iterations of the questioning process to arrive at the root cause of the problem and that's why this model got its name as 5 Whys. But it is perfectly fine for a facilitator to ask less or more questions depending on the needs.

Related training: Accident/Incident Investigation and Root Cause Analysis
4. Failure Mode and Effects Analysis (FMEA)
FMEA is a technique used to identify process and product problems before they occur. It focuses on how and when a system will fail, not if it will fail. In this model, each failure mode is assessed for:
- Severity (S)
- Occurrence (O)
- Detection (D)
A combination of the three scores produces a risk priority number (RPN). The RPN is then provided a ranking system to prioritize which problem must gain more attention first.
Related Training: Failure Mode Effects Analysis
5. Scatter Diagram

A scatter diagram also known as a scatter plot is a graph in which the values of two variables are plotted along two axes, the pattern of the resulting points revealing any correlation present.
To use scatter plots in root cause analysis, an independent variable or suspected cause is plotted on the x-axis and the dependent variable (the effect) is plotted on the y-axis. If the pattern reflects a clear curve or line, it means they are correlated. If required, more sophisticated correlation analyses can be continued.
Related Training: Excel Charting Basics - Produce Professional-Looking Excel Charts
6. Affinity Diagram
Also known as KJ Diagram, this model is used to represent the structure of big and complex factors that impact a problem or a situation. It divides these factors into small classifications according to their similarity to assist in identifying the major causes of the problem.

7. Fault Tree Analysis (FTA)
The Fault Tree Analysis uses Boolean logic to arrive at the cause of a problem. It begins with a defined problem and works backward to identify what factors contributed to the problem using a graphical representation called the Fault Tree. It takes a top-down approach starting with the problem and evaluating the factors that caused the problem.

Finding the root cause isn't an easy because there is not always one root cause. You may have to repeat your experiment several times to arrive at it to eliminate the encountered problem. Using a scientific approach to solving problem works. So, its important to learn the several problem-solving tools and techniques at your fingertips so you can use the ones appropriate for different situations.
ComplianceOnline Trainings on Root Cause Analysis
P&PC, SPC/6Sigma, Failure Investigation, Root Cause Analysis, PDCA, DMAIC, A3 This webinar will define what are the US FDA's expectation for Production and Process Control / Product Realization, the use of statistical tehniques, 6 sigma, SPC, for establishing, controlling , and verifying the acceptability of process capability and product characteristics, product acceptance or validation and other studies. Non-conformance, OOS, deviations Failure Investigations, and Root Cause Analysis, PDCA, DMAIC, and similar project drivers to improvement, A# and similar dash boards.
Accident/Incident Investigation and Root Cause Analysis If a major workplace injury or illness occurred, what would you do? How would you properly investigate it? What could be done to prevent it from happening again? A properly executed accident/incident investigation drives to the root causes of the workplace accident to prevent a repeat occurrence. A good accident/incident investigation process includes identifying the investigation team, establishing/reviewing written procedures, identifying root causes and tracking of all safety hazards found to completion.
Root Cause Analysis - The Heart of Corrective Action This presentation will explain the importance of root cause analysis and how it fits into an effective corrective and preventive action system. It will cover where else in your quality management system root cause analysis can be used and will give examples of some of the techniques for doing an effective root cause analysis. Attendees will learn how root cause analysis can be used in process control.
Addressing Non-Conformances using Root Cause Analysis (RCA) RCA assumes that systems and events are interrelated. An action in one area triggers an action in another, and another, and so on. By tracing back these actions, you can discover where the issue started and how it grew into the problem you're now facing.
Introduction to Root Cause Investigation for CAPA If you have reoccurring problems showing up in your quality systems, your CAPA system is not effective and you have not performed an in-depth root cause analysis to be able to detect through proper problem solving tools and quality data sources, the true root cause of your problem. Unless you can get to the true root cause of a failure, nonconformity, defect or other undesirable situation, your CAPA system will not be successful.
Root Cause Analysis and CAPA Controls for a Compliant Quality System In this CAPA webinar, learn various regulations governing Corrective and Preventive Actions (CAPA) and how organization should collect information, analyze information, identify, investigate product and quality problems, and take appropriate and effective corrective and/or preventive action to prevent their recurrence.
Root Cause Analysis for CAPA Management (Shutting Down the Alligator Farm) Emphasis will be placed on realizing system interactions and cultural environment that often lies at the root of the problem and prevents true root cause analysis. This webinar will benefit any organization that wants to improve the effectiveness of their CAPA and failure investigation processes.
Root Cause Analysis for Corrective and Preventive Action (CAPA) The Quality Systems Regulation (21 CFR 820) and the Quality Management Standard for Medical Devices (ISO 13485:2003), require medical device companies to establish and maintain procedures for implementing corrective and preventive action (CAPA) as an integral part of the quality system.
Strategies for an Effective Root Cause Analysis and CAPA Program This webinar will provide valuable assistance to all regulated companies, a CAPA program is a requirement across the Medical Device, Diagnostic, Pharmaceutical, and Biologics fields. This session will discuss the importance, requirements, and elements of a root cause-based CAPA program, as well as detailing the most effective ways to determine root cause and describing the uses of CAPA data.
Legal Disclaimer
This piece of content and any of its enclosures, attachments or appendices, references are created to provide solely for information purpose. ComplianceOnline has made all effort to provide accurate information concerning the subject matter covered. This content is created from interpretation, and understanding of relevant and applicable information and it is not all inclusive. It can be best used in conjunction with your professional judgment and discretion.
However, this piece of content and any other ancillary items disseminated in connection with same are not necessarily prepared by a person licensed to practice law in a particular jurisdiction. This piece of content is not a substitute for the advice of an attorney. If you require legal or other expert advice, you should seek the services of a competent attorney or other professional.
ComplianceOnline necessarily is not, cannot and will not be liable for any claims, damages, or regulatory legal proceedings initiated as a consequence of you using whole or any part of the content present in this document. If any action, claim for damages, or regulatory proceedings is commenced against ComplianceOnline as a consequence of your use of this document, then and in that event, you agree to indemnify ComplianceOnline for such claims, and for any attorney's fees expended by ComplianceOnline in connection with defense of same.
Introduction to Industrial Engineering
(2 reviews)
Bonnie Boardman
Copyright Year: 2020
ISBN 13: 9781648169823
Publisher: Mavs Open Press
Language: English
Formats Available
Conditions of use.
Learn more about reviews.
Reviewed by Polinpapilinho Katina, Assistant Professor, USC-Upstate on 5/21/21
The text covers all areas and ideas of the subject of industrial engineering appropriately and provides an effective index and/or glossary. However, the logical progressional of chapters could be aided by first providing the foundational... read more
Comprehensiveness rating: 4 see less
The text covers all areas and ideas of the subject of industrial engineering appropriately and provides an effective index and/or glossary. However, the logical progressional of chapters could be aided by first providing the foundational information (e.g., Systems Thinking) and then progressing into the core of industrial engineering.
Content Accuracy rating: 5
The text covers well the selected topics (i.e., Industrial Engineering, Teamwork, Problem Solving, Big Ideas in Industrial Engineering, Using Models, Deming’s 14 Points, People in the System, Systems Thinking, Lean Operations, The IE Approach, Organizations’ Missions, Visions, and Values, Lifelong Learning). An undergraduate student is provided enough details to grasp the fundamentals of IE and leave them wanting to know more about IE.
Relevance/Longevity rating: 4
The content of this textbook is the stake of current knowledge on the topics selected. Moreover, the book is written in such a manner that it can easily compare emerging topics (e.g., industrial vulnerability, industry 4.0). These could easily be included in Chapter 4. Any necessary updates will be relatively easy and straightforward to implement.
Clarity rating: 5
The text is written in accessible prose and provides adequate context for any jargon/technical terminology used, meaning that any undergraduate student should be able to understand the content and context. In any area that the student is not fluid, certainly, the instructor will be able to explain.
Consistency rating: 5
From the get-go, the text is internally consistent in terms of terminology and the IE framework. Words such as “system” and “safety” are defined in chapter 1 and are used consistently.
Modularity rating: 5
The text is easily and readily divisible into smaller reading sections assigned at different points within the course. In fact, many of the chapters are relatively small that they could be read and discussed in a short period of time.
Organization/Structure/Flow rating: 4
For a large part, the topics of the text are presented in a logical, clear fashion. However, the chapter on “systems thinking” should appear first to provide foundational information on systems/General Systems Theory before moving into Industrial Engineering.
Interface rating: 5
The text is well crafted and is without significant interface issues. The chapters are accessible, and one is clearly able to view images and charts.
Grammatical Errors rating: 5
The textbook does not contain any significant grammar and syntax issues
Cultural Relevance rating: 5
The text is culturally insensitive and does not contain offensive language.
Reviewed by David Olawale, Assistant Professor, University of Indianapolis on 4/23/21
I like the key concepts covered. They are critical to an IE and can be covered within a semester-long course. I particularly like the order of the topics. read more
I like the key concepts covered. They are critical to an IE and can be covered within a semester-long course. I particularly like the order of the topics.
The contents are accurate and there is proper attribution to the sources of information.
The content is fundamental and will not easily become obsolete. The organization of content is such that it will be relatively easy to update.
The language and writing style is very easy for anyone (first-year college student) to understand.
Consistency rating: 4
It would have been nice if there was a short introduction at the beginning of each chapter.
The chapters are relatively short.
Organization/Structure/Flow rating: 5
Interface rating: 4
It worked well.
Grammatical Errors rating: 4
Pg 3 - Minor grammatical errors e.g. “Certain words are show…” instead of 'shown'. Little error under Safety and Work Environment section: “The system should be changed to eliminate or reduce the change of that type of accident occurring.”
It is not culturally insensitive.
It would have been nice if there was a short introduction at the beginning of each chapter. Exercise should include some quantitative problems e.g. chapter 5 on Models.
Table of Contents
- 1. What is Industrial Engineering?
- 2. Teamwork
- 3. What is Problem Solving?
- 4. Big Ideas in Industrial Engineering
- 5. Using Models
- 6. Deming's 14 Points
- 7. People in the System
- 8. Systems Thinking
- 9. Lean Operations
- 10. The IE Approach
- 11. Organizations' Missions, Visions, and Values
- 12. Lifelong Learning
Ancillary Material
About the book.
This book was created for an undergraduate Introduction to Industrial Engineering course at The University of Texas at Arlington (UTA). The chapters give an overview of the profession and an introduction to some of the tools used by industrial engineers in industry. There are interactive content exercises included at the end of most chapters. This interactive content aims to engage students in the content as they are reading. The book will continue to revised and updated with new information as it becomes necessary.
About the Contributors
Contribute to this page.
5 Root Cause Analysis Tools for More Effective Problem-Solving

Next to defining a problem accurately, root cause analysis is one of the most important elements of problem-solving in quality management. That’s because if you’re not aiming at the right target, you’ll never be able to eliminate the real problem that’s hurting quality.
So which type of root cause analysis tool is the best one to use? Manufacturers have a range of methods at their fingertips, each of which is appropriate for different situations. Below we discuss five common root cause analysis tools, including:
- Pareto Chart
- Fishbone Diagram
- Scatter Diagram
- Failure Mode and Effects Analysis (FMEA)
Download our free Root Cause Analysis 101 Guidebook Read 14 quality metrics every executive should know
1. Pareto Chart
A Pareto chart is a histogram or bar chart combined with a line graph that groups the frequency or cost of different problems to show their relative significance. The bars show frequency in descending order, while the line shows cumulative percentage or total as you move from left to right.

The Pareto chart example above is a report from layered process audit software that groups together the top seven categories of failed audit questions for a given facility. Layered process audits (LPAs) allow you to check high-risk processes daily to verify conformance to standards. LPAs identify process variations that cause defects, making Pareto charts a powerful reporting tool for analyzing LPA findings.
Pareto charts are one of the seven basic tools of quality described by quality pioneer Joseph Juran. Pareto charts are based on Pareto’s law, also called the 80/20 rule, which says that 20% of inputs drive 80% of results.
Learn how to create Pareto charts in this post or download the Pareto Chart Tip Sheet and Sample Excel File
The 5 Whys is a method that uses a series of questions to drill down into successive layers of a problem. The basic idea is that each time you ask why, the answer becomes the basis of the next why. It’s a simple tool useful for problems where you don’t need advanced statistics, so you don’t necessarily want to use it for complex problems.
One application of this technique is to more deeply analyze the results of a Pareto analysis. Here’s an example of how to use the 5 Whys:
Problem: Final assembly time exceeds target
- Why is downtime in final assembly higher than our goal? According to the Pareto chart, the biggest factor is operators needing to constantly adjust Machine A
- Why do operators need to constantly adjust Machine A? Because it keeps having alignment problems
- Why does Machine A keep having alignment problems? Because the seals are worn
- Why are Machine A’s seals worn? Because they aren’t being replaced as part of our preventive maintenance program
- Why aren’t they being replaced as part of our preventive maintenance program? Because seal replacement wasn’t captured in the needs assessment
Of course, it may take asking why more than five times to solve the problem—the point is to peel away surface-level issues to get to the root cause.
Learn more about the 5 Whys method in this blog post or download our free 5 Whys worksheet
3. Fishbone Diagram
A fishbone diagram sorts possible causes into various categories that branch off from the original problem. Also called a cause-and-effect or Ishakawa diagram, a fishbone diagram may have multiple sub-causes branching off of each identified category.

Learn more about how to use a fishbone diagram in this blog post and download our free set of fishbone diagram templates
4. Scatter Plot Diagram
A scatter plot or scatter diagram uses pairs of data points to help uncover relationships between variables. A scatter plot is a quantitative method for determining whether two variables are correlated, such as testing potential causes identified in your fishbone diagram.
Making a scatter diagram is as simple as plotting your independent variable (or suspected cause) on the x-axis, and your dependent variable (the effect) on the y-axis. If the pattern shows a clear line or curve, you know the variables are correlated and you can proceed to regression or correlation analysis.
Download a free tip sheet to start creating your own scatter diagrams today!
5. Failure Mode and Effects Analysis (FMEA)
Failure mode and effects analysis (FMEA) is a method used during product or process design to explore potential defects or failures. An FMEA chart outlines:
- Potential failures, consequences and causes
- Current controls to prevent each type of failure
- Severity (S), occurrence (O) and detection (D) ratings that allow you to calculate a risk priority number (RPN) for determining further action
When applied to process analysis, this method is called process failure mode and effects analysis (PFMEA). Many manufacturers use PFMEA findings to inform questions for process audits , using this problem-solving tool to reduce risk at the source.
No matter which tool you use, root cause analysis is just the beginning of the problem-solving process. Once you know the cause, the next step is implementing a solution and conducting regular checks to ensure you’re holding the gain and achieving sustainable continuous improvement.
Download our free Root Cause Analysis 101 Guidebook

Related articles
IE Tools for Boosting Competitiveness in Iron and Steel Industry: A Review
- Original Article
- Published: 07 April 2021
- Volume 74 , pages 1065–1076, ( 2021 )
Cite this article

- Milind Akarte 1 ,
- Vivek Khanzode 1 ,
- Rauf Iqbal 1 &
- Manoj Kumar Tiwari 1
543 Accesses
3 Citations
Explore all metrics
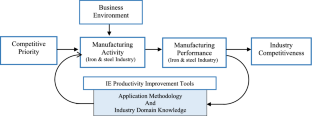
Integrated steelmaking operations, from ironmaking to final steel categories/forms, are a complex industrial system. Decision-makers, in addition to the domain knowledge, need to understand many facets related to operations management, process execution, involved risk factors and material handling aspects, etc. The solution approach must address trade-offs, uncertainties, multiple stages, multiple objectives, many decision variables, and constraints. Literature has presented several Industrial Engineering approaches like multi-objective optimisation, heuristics, evolutionary algorithm, Simulations, lean six-sigma, etc., to address the iron and steel industry's complex problems like integrated production planning. The manuscript reviews recent application of these IE tools/solution approaches in iron and steel industries to enhanced productivity/competitiveness. A Systematic Literature Review (SLR) methodology has been adopted. The review will help the practitioners and academicians to know the different problem areas about iron and steel industries discussed in the literature, and the solution approaches used to solve the problem.
This is a preview of subscription content, log in via an institution to check access.
Access this article
Price excludes VAT (USA) Tax calculation will be finalised during checkout.
Instant access to the full article PDF.
Rent this article via DeepDyve
Institutional subscriptions
Improving the Flexibility of Production Scheduling in Flat Steel Production Through Standard and AI-Based Approaches: Challenges and Perspectives

Applications of Mathematical Programming Models for Product Mix Optimization in World Steel Industry: Challenges and Directions

Operation optimization of the steel manufacturing process: A brief review
IISE Body of Knowledge, available at https://www.iise.org/details.aspx?id=43631 , visited in October 2020.
IISE Management Engineering, Industrial and Systems Engineering, available at https://www.iise.org/SHS/details.aspx?id=18280 , visited October 2020.
Steel sector achievement report, (2017). Department of Industrial Policy and Promotion, Ministry of Steel, available at https://drive.google.com/file/d/0B-Tv7_upCKANLVp6N0N3czhYa00/view , visited in October 2020.
Steel industry in China - statistics and facts, 2020, available at https://www.statista.com/topics/5695/steel-industry-in-china/ , visited in October 2020.
Benjamin Bartholomew, (2019). THE STEEL INDUSTRY AND ITS PLACE IN THE AMERICAN ECONOMY, AUGUST 2019 available at, https://www.bdo.com/insights/business-financial-advisory/valuation-business-analytics/the-steel-industry-and-its-place-in-the-american-e , visited in October 2020.
KAWASAKI STEEL 21st Century Foundation, Introduction of Iron and steel Processing. http://www.jfe-21st-cf.or.jp/index2.html . visited January 2021 .
Editorial, (2019). The Emergence of Digital Platforms: A Conceptual Platform Architecture and impact on Industrial Engineering, Computers & Industrial Engineering , 136:546-555.
Article Google Scholar
Thomé AMT, Scavarda LF & Scavarda AJ, (2016). Conducting systematic literature review in operations management, Production Planning & Control , 27:408-420.
Garza-Reyes JA, Al-Balushi M, Antony J, and Kumar V, ( 2016). A Lean Six Sigma framework for the reduction of ship loading commercial time in the iron ore pelletising industry, Production Planning & Control , 27: 1092-1111.
Li F, Chen ZL, and Tang L, (2017). Integrated Production, Inventory and Delivery Problems: Complexity and Algorithms, INFORMS Journal on Computing, 29: 232-250.
Dutta G, Fourer R, (2001). A Survey of Mathematical Programming Applications in Integrated Steel Plants, Manufacturing & Service Operations Management, 3:387-400.
Zhang T, Zheng QP, Fang Y, and Zhang Y, (2015). Multi-level inventory matching and order planning under the hybrid Make-To-Order/Make-To-Stock production environment for steel plants via Particle Swarm Optimization, Computers & Industrial Engineering, 87: 238-249.
Lin J, Liu M, Hao J, and Jiang S, (2016). A multi-objective optimisation approach for integrated production planning under interval uncertainties in the steel industry, Computers & Operations Research , 72 :189-203.
Dong Y, and Zhao R, (2018). Solve train stowage planning problem of steel coil using a pointer-based discrete differential evolution, International Journal of Production Research , 56:6937-6955.
Dong Y, and Zhao R, (2019). Solving steel coil ship stowage-planning problem using hybrid differential evolution, International Journal of Production Research, 57: 5767 -5786.
Dong Y, Zhao R, Xu W, Yang M, and Jiang W, (2020). Integrated optimisation of consolidation and stowage planning of steel coil ships using differential evolution, International Journal of Production Research , https://doi.org/10.1080/00207543.2020.1722323 .
Tan Y, Zhou M, Wang Y, Guo X, and Qi L, (2019). A Hybrid MIP–CP Approach to Multistage Scheduling Problem in Continuous Casting and Hot-Rolling Processes, IEEE Transactions on Automation Science and Engineering, 16:1860-1869.
Guo Q, and Tang L, (2019). Modelling and discrete differential evolution algorithm for order rescheduling problem in steel industry, Computers & Industrial Engineering, 130:586-596.
Pan QK, (2016). An effective co-evolutionary artificial bee colony algorithm for steelmaking-continuous casting scheduling, European Journal of Operational Research, 250:702-714.
Mao K, Pan QK, Chai T, and Luh PB, (2015). An Effective Subgradient Method for Scheduling a Steelmaking-Continuous Casting Process, IEEE Transactions on Automation Science and Engineering , 12:1140-1152.
Li C, Qin J, Li J, and Hou Q, (2016). The accident early warning system for iron and steel enterprises based on combination weighting and Grey Prediction Model GM (1, 1), Safety Science, 89:19-27.
Long J, Zheng Z, Gao X, and Pardalos PM, (2016). A hybrid multi-objective evolutionary algorithm based on NSGA-II for practical scheduling with release times in steel plants, Journal of the Operational Research Society, 67 :1184–1199.
Zheng Z, Long JY, and Gao XQ, (2017). Production scheduling problems of steelmaking-continuous casting process in dynamic production environment, Journal of Iron and Steel Research International, 24:586-594.
Hao J, Liu M, Jiang S, and Wu C, (2015). A soft-decision based two-layered scheduling approach for uncertain steelmaking-continuous casting process, European Journal of Operational Research, 244:966-979.
Kano M, Nakagawa Y, (2008). Data-based process monitoring, process control, and quality improvement: Recent developments and applications in steel industry, Computers and Chemical Engineering , 32:12-24.
Article CAS Google Scholar
Prinz K, Steinboeck A, Müller M, Ettl A, Schausberger F, and Kugi A, (2019). Online Parameter Estimation for Adaptive Feedforward Control of the Strip Thickness in a Hot Strip Rolling Mill, Journal of Manufacturing Science and Engineering, 141:071005. https://doi.org/ https://doi.org/10.1115/1.4043575 .
Shahin A, Labib A, Emami S, and Karbasian M, (2019). Improving Decision-Making Grid based on interdependence among failures with a case study in the steel industry, The TQM Journal, 31:167-182.
Mohanty I, Sarkar S, Jha B, Das S & Kumar R, (2014). Online mechanical property prediction system for hot rolled IF steel, Ironmaking & Steelmaking , 41(8):618-627, https://doi.org/10.1179/1743281214Y.0000000178 .
Jena N, Seth N, (2016). Factors influencing logistics cost and service quality: a survey within the Indian steel sector, Industrial and Commercial Training , 48:199-207. https://doi.org/10.1108/ICT-09-2015-0057 .
Ge P, Meng Y, Liu J, Tang L, and Zhao R, (2020). Logistics optimisation of slab pre-marshalling problem in steel industry, International Journal of Production Research , 58: 4050-4070.
Nordlöf H, Wiitavaara B, Winblad U, Wijk K, and Westerling R, (2015). Safety culture and reasons for risk-taking at a large steel-manufacturing company: Investigating the worker perspective, Safety Science, 73 :126-135.
Koivupalo M, Sulasalmi M, Rodrigo P, and Väyrynen S, (2015). Health and safety management in a changing organisation: Case study global steel company, Safety Science, 74:28-139.
International Labour Organization, 2005, https://www.ilo.org/global/publications/books/WCMS_081882/lang--en/index.htm.(visited February 2021)
National Security Council (NSC), 1947. Milestones: 1945–1952 - Office of the Historian (state.gov).
Nazaripour E, Halvani G, Jahangiri M, Fallahzadeh H, and Mohammadzadeh M, (2018). Safety performance evaluation in a steel industry: A short-term time series approach, Safety Science, 110:285-290.
Waters T, Putz-Anderson V, Garg A, Fine L, (1993). Revised NIOSH equation for the design and evaluation of manual lifting tasks. Ergonomics , 36:749-776.
Hignett S and McAtamney L, (2000). Rapid Entire Body Assessment (REBA). Applied Ergonomics , 31:201-205. https://doi.org/10.1016/S0003-6870(99)00039-3 .
McAtamney L and Corlett NE, (1993). RULA: a survey method for the investigation of work-related upper limb disorders. Appl Ergon. 24:91-9. https://doi.org/10.1016/0003-6870(93)90080-s .
Liu J, An R, Xiao R, Yang Y, Wang G, and Wang Q, (2017). Implications from substance flow analysis, supply chain and supplier’ risk evaluation in iron and steel industry in Mainland China, Resources Policy, 51:272-282.
Jain N, and Singh AR, (2020). Sustainable supplier selection criteria classification for Indian iron and steel industry: a fuzzy modified Kano model approach, International Journal of Sustainable Engineering , 13:17-32.
Pena JG, de Oliveira Junior VB, and Salles JL, (2019). Optimal scheduling of a by-product gas supply system in the iron- and steel-making process under uncertainties Computers & Chemical Engineering , 125:351-364.
Mehmanpazir F, Khalili-Damghani K, and Hafezalkotob A, (2019). Modeling steel supply and demand functions using logarithmic multiple regression analysis (case study: Steel industry in Iran), Resources Policy, 63 :101409.
Azimifard A, Moosavirad SH, and Ariafar S, (2018). Selecting sustainable supplier countries for Iran's steel industry at three levels by using AHP and TOPSIS methods, Resources Policy, 57 :30-44.
Daoutidis, P., Lee, J.H., Harjunkoski, I., Skogestad, S., Baldea, M. and Georgakis, C. (2018). Integrating operations and control: A perspective and roadmap for future research. Computers & Chemical Engineering , 115:179-184.
Ghanbari H, Pettersson F, Saxén H, (2015). Optimal operation strategy and gas utilisation in a future integrated steel plant, Chemical Engineering Research and Design , 102:322-336.
Ravi B, (2016). SMART Foundry 2020, IEEE POTENTIALS 0278–6648/16©2016 IEEE.
Yokogawa, Industrial Automation and Test and Measurement solutions. https://www.yokogawa.com/in/library/resources/application-notes/instruments-andsolution-for-iron-steel-industry-pdf/ (visited on February 09, 2021).
SICK sensor technology, (2021) https://sickusablog.com/optimizing-manufacturing-processes-steel-industry/ (visited on February 09, 2021).
Neef C, Hirzel S, and Arens M, (2018). Industry 4.0 in the European Iron and Steel Industry: Towards an Overview of Implementations and Perspectives, Fraunhofer Institute for Systems and Innovation Research ISI Karlsruhe, Germany.
Miśkiewicz R, and Wolniak R, (2020). Practical Application of the Industry 4.0 Concept in a Steel Company, Sustainability , 12:5776, https://doi.org/10.3390/su12145776 .
Casado S, Laguna M, Pacheco J, and Puche JC, (2020). Grouping products for the optimisation of production processes: A case in the steel manufacturing industry, European Journal of Operational Research , 286:190-202.
Özgür A, Uygun Y, and Hütt MT, (2020). A review of planning and scheduling methods for hot rolling mills in steel production, Computers & Industrial Engineering (in press). https://doi.org/10.1016/j.cie.2020.106606 .
Fukuyama H, Liu HH, Song YY, and Yang GL, (2021). Measuring the capacity utilisation of the 48 largest iron and steel enterprises in China, European Journal of Operational Research, 288: 648-665.
Tang L, Meng Y, Chen ZL, and Liu J, (2016). Coil Batching to Improve Productivity and Energy Utilization in Steel Production, Manufacturing & Service Operations Management 18:262-279.
Lin J, Liu M, Hao J, and Gu P, (2017). Many-objective harmony search for integrated order planning in steelmaking-continuous casting-hot rolling production of multi-plants, International Journal of Production Research , 55:4003-4020.
Wang Y, Chen C, Tao Y, Wen Z, Chen B, and Zhang H, (2019). A many-objective optimisation of industrial environmental management using NSGA-III: A case of China's iron and steel industry, Applied Energy, 242:46-56.
Fanti MP, Rotunno G, Stecco G, Ukovich W, and Mininel S, (2016). An Integrated System for Production Scheduling in Steelmaking and Casting Plants, IEEE Transactions on Automation Science and Engineering , 13: 1112 - 1128.
Browne F, Chiu GT, and Jain N, (2019). A Nonlinear Dynamic Switched-Mode Model of Twin-Roll Steel Strip Casting, Journal of Dynamic Systems, Measurement, and Control, 141: 081004 (10 pages).
Zhao XC, Bai H, Lu X, Shi Q, and Han J, (2015). A MILP model concerning the optimisation of penalty factors for the short-term distribution of byproduct gases produced in the iron and steel making process. Applied Energy , 148:142-158.
Maddaloni A, Porzio GF, Nastasi G, Colla V, and Branca TA, (2015). Multi-objective optimisation applied to retrofit analysis: A case study for the iron and steel industry, Applied Thermal Engineering , 91:638-646.
Mele M, and Magazzino C, (2020). A Machine Learning analysis of the relationship among iron and steel industries, air pollution, and economic growth in China, Journal of Cleaner Production, 277:123293. https://doi.org/10.1016/j.jclepro.2020.123293 .
Nielsen H, (2017). Productive efficiency in the iron and steel sector under state planning: The case of China and former Czechoslovakia in a comparative perspective, Applied Energy, 185: 1732-1743.
Download references
Author information
Authors and affiliations.
National Institute of Industrial Engineering, Mumbai, India
Milind Akarte, Vivek Khanzode, Rauf Iqbal & Manoj Kumar Tiwari
You can also search for this author in PubMed Google Scholar
Corresponding author
Correspondence to Manoj Kumar Tiwari .
Additional information
Publisher's note.
Springer Nature remains neutral with regard to jurisdictional claims in published maps and institutional affiliations.
Rights and permissions
Reprints and permissions
About this article
Akarte, M., Khanzode, V., Iqbal, R. et al. IE Tools for Boosting Competitiveness in Iron and Steel Industry: A Review. Trans Indian Inst Met 74 , 1065–1076 (2021). https://doi.org/10.1007/s12666-021-02228-3
Download citation
Received : 26 January 2021
Accepted : 23 February 2021
Published : 07 April 2021
Issue Date : May 2021
DOI : https://doi.org/10.1007/s12666-021-02228-3
Share this article
Anyone you share the following link with will be able to read this content:
Sorry, a shareable link is not currently available for this article.
Provided by the Springer Nature SharedIt content-sharing initiative
- Industrial Engineering
- Optimization
- Iron and steel industry
- Productivity improvement
- Solution approaches
- Find a journal
- Publish with us
- Track your research
- In-house Training
Have Kaizen activities been carried out smoothly at your company’s production site?
- Your factory leaders and staff have basic understanding of Kaizen, but don’t know where and how to start your Kaizen activities?
- The result of waste elimination activities does not meet your company’s expectation?
- You have little opportunities to take part in courses focusing on useful and effective tools for Kaizen?
- Training venue:
- Training method:
- Have a basic knowledge of 7 Industrial Engineering (IE) tools and their applications.
- Be able to apply 7 IE tools to production site.
- Be able to conduct Kaizen activities by using 7 IE tools.
- Middle and junior factory managers (Chief, Foreman, Supervisor etc.) in the production management department or in charge of Kaizen activities.
- The definition of IE (Industrial Engineering)
- The 7 wastes in manufacturing activities
- ECRS Principle
- 1. Process analysis ~ Analyze whole production process from raw materials to final product, in order to eliminate wastes and carry out Kaizen activities~
- 2. Motion analysis ~ Analyze motions to eliminate wasted movements and to re-arrange the movements’ order and co-ordination with less labor-consuming and higher economic effectiveness ~
- 3. Time Study ~ Analyze movements from work time perspective to eliminate wastes and improve productivity ~
- 4. Operation analysis ~ Analyze the movements of man and machines to calculate the time-consuming ratio of each activities to the entire process ~
- 5. Combination work analysis ~ Analyze the time-consuming relationships between combined movements (between Man and Machines or among Men) to re-arrange the process with higher productivity ~
- 6. Line balancing analysis ~ Design a harmonious production flow which could remove the differences of necessary time-consuming between each stages ~
- 7. Material handling ~ Analyze the product transfer flow process to reduce time-consuming and wastes ~
- IE tools applications to PDCA cycle (Plan – Do – Check – Act)
- 7 steps to conduct improvement activities
COURSE EVALUATION
189 Participants have joined this course.
75 Companies have used our service for this course.
100% Participants evaluate the course is "Useful" (In which, "Very useful" is 69%)
99% Participants evaluate the consultant is "Good" (In which, "Very good" is 61%)
Participants' feedback
"I get more knowledge to conduct kaizen activities at production site. "
(A participant from Public course, 2015)
"Know how to apply IE tools to analyze and improve productivity. "
"7 IE tools" pamphlet
- Japanese : Download (PDF)
- English : Download (PDF)
- Vietnamese : Download (PDF)
For the sample of training material please send your request to us here .
1-DAY FOLLOW UP PROGRAM
To enhance participants’ practical skills, it's recommended that companies not only conduct training program, but also hold follow-up program to continuously support participants' implementation after the training.
Duration: 1 day (1 month after training)
- Participants review and deepen the knowledge and skills
- Participants learn how to put knowledge into actual practice at their workplace
- Participants notice their weaknesses and learn how to improve them
※ For more details, click here .
CONSULTING PROGRAM FOR GEMBA KAIZEN
The 5 follow-up days shall ensure that participants are capable in using their new skills and confidently applying such skills to solve actual issues at their workplace.
Duration: 6 months (8 days for training and consulting)
Objectives:
- Understand the basic knowledge and usage of the seven tools and use them for on-site kaizen activities
- Utilize the opportunities to apply the knowledge of IE seven tools learned in the training into actual practice and workplace
※ In addition, we can customize the program based on client's issues, request, and expectation.

Tools & Techniques of Industrial Engineering Used in Apparel Industry
Last Updated on 06/09/2021
Tools & Techniques of Industrial Engineering Used in Apparel Industry
Md. Noor Nabi Raaz Faculty Member, Dept. of Textile Engineering, Atish Dipankar University of Science & Technology Email: [email protected]
Concept of Industrial Engineering (IE): Industrial Engineering (IE) is concerned with the design, Improvement, and installation of integrated system of men, material, and machines for the benefit of mankind. It draws upon specialized knowledge and skills in the mathematical and physical sciences together with the principles and methods of engineering analysis and design to specify, predict and evaluate the results to be obtained from such systems. Now industrial engineering is an integral part of garment manufacturing . It is treated one of the important element in the apparel industry to improve productivity and secure requested delivery date. By applying IE tools and techniques, engineers can enhance the production floor performance. In this article I will discuss on different tools and techniques of industrial engineering those are applied in apparel industry.

Tools of Industrial Engineering: The main aim of tools are to improve the productivity of the organization by optimum utilization of organizations resources: men, materials, and machines. The major tools used in industrial engineering are:
- Production planning and control .
- Inventory control.
- Job evaluation.
- Facilitates planning and material handling.
- System analysis.
- Linear programming.
- Simulation.
- Network analysis (PERT, CPM).
- Queuing models.
- Assignment.
- Sequencing and transportation models.
- Games theory and dynamic programming.
- Group technology.
- Statistical techniques.
- Quality control.
- Decision making theory.
- Replacement models.
- Assembly line balancing .
- MRP, JIT, ISO, TQM etc.
Techniques of Industrial Engineering: Planning and designing manufacturing processes and equipment is a main aspect of being an industrial technologist. An Industrial Engineer is often responsible for implementing certain designs and processes. Industrial Technology involves the management, operation, and maintenance of complex operation systems. Techniques of industrial engineering are-
1. Method study : To establish a standard method of performing a job or an operation after thorough analysis of the jobs and to establish the layout of production facilities to have a uniform flow of material without back tracking.
2. Time study ( work measurement ): This is a technique used to establish a standard time for a job or for an operation.
3. Motion Economy: This is used to analyses the motions employed by the operators do the work. The principles of motion economy and motion analysis are very useful in mass production or for short cycle repetitive jobs.
4. Value Analysis: It ensures that no unnecessary costs are built into the product and it tries to provide the required functions at the minimum cost. Hence, helps to enhance the worth of the product.
5. Financial and non-financial Incentives: These helps to evolve at a rational compensation for the efforts of the workers.
6. Production, Planning and Control: This includes the planning for the resources (like men, materials and machine) proper scheduling and controlling production activities to ensure the right quantity, quality of product at predetermined time and pre-established cost.
7. Inventory Control: To find the economic lot size and the reorder levels for the items so that the item should be made available to the production at the right time and quantity to avoid stock out situation and with minimum capital lock-up.
8. Job Evaluation: This is a technique which is used to determine the relative worth of jobs of the organization to aid in matching jobs and personnel and to arrive at sound wage policy.
9. Material Handling Analysis: To scientifically analysis the movement of materials through various departments to eliminate unnecessary movement to enhance the efficiency of material handling.
10. Ergonomics (Human Engineering): It is concerned with study of relationship between man and his working conditions to minimize mental and physical stress. It is concerned with man-machine system.
You may also like:
- Module & Responsibility of Industrial Engineering Department for Apparel Production
- Method Study in Apparel Industry – A Systematic Approach
- Benefits of Work Study in Garments Industry
- Industrial Engineering Formulas for Textile Students and Professionals
- Line Balancing and Bottleneck in Garment Production Line
- Techniques and Applications of Work Measurement in Apparel Industry
- Working Procedure of Method Study in Garment Industry
Are you looking for someone to help do your engineering assignments? You are not alone. Feel free to pay My Assignment Lab to get your homework done online.

Founder & Editor of Textile Learner. He is a Textile Consultant, Blogger & Entrepreneur. He is working as a textile consultant in several local and international companies. He is also a contributor of Wikipedia.
Share this Article!
Related Posts:

Leave a Comment Cancel reply
Save my name, email, and website in this browser for the next time I comment.
Notify me of follow-up comments by email.
Notify me of new posts by email.
- Skip to main content
- Skip to primary sidebar
- Skip to footer
Additional menu
Nine essential problem solving tools: The ultimate guide to finding a solution
October 26, 2023 by MindManager Blog
Problem solving may unfold differently depending on the industry, or even the department you work in. However, most agree that before you can fix any issue, you need to be clear on what it is, why it’s happening, and what your ideal long-term solution will achieve.
Understanding both the nature and the cause of a problem is the only way to figure out which actions will help you resolve it.
Given that most problem-solving processes are part inspiration and part perspiration, you’ll be more successful if you can reach for a problem solving tool that facilitates collaboration, encourages creative thinking, and makes it easier to implement the fix you devise.
The problem solving tools include three unique categories: problem solving diagrams, problem solving mind maps, and problem solving software solutions.
They include:
- Fishbone diagrams
- Strategy maps
- Mental maps
- Concept maps
- Layered process audit software
- Charting software
- MindManager
In this article, we’ve put together a roundup of versatile problem solving tools and software to help you and your team map out and repair workplace issues as efficiently as possible.
Let’s get started!
Problem solving diagrams
Mapping your way out of a problem is the simplest way to see where you are, and where you need to end up.
Not only do visual problem maps let you plot the most efficient route from Point A (dysfunctional situation) to Point B (flawless process), problem mapping diagrams make it easier to see:
- The root cause of a dilemma.
- The steps, resources, and personnel associated with each possible solution.
- The least time-consuming, most cost-effective options.
A visual problem solving process help to solidify understanding. Furthermore, it’s a great way for you and your team to transform abstract ideas into a practical, reconstructive plan.
Here are three examples of common problem mapping diagrams you can try with your team:
1. Fishbone diagrams
Fishbone diagrams are a common problem solving tool so-named because, once complete, they resemble the skeleton of a fish.
With the possible root causes of an issue (the ribs) branching off from either side of a spine line attached to the head (the problem), dynamic fishbone diagrams let you:
- Lay out a related set of possible reasons for an existing problem
- Investigate each possibility by breaking it out into sub-causes
- See how contributing factors relate to one another

Fishbone diagrams are also known as cause and effect or Ishikawa diagrams.
2. Flowcharts
A flowchart is an easy-to-understand diagram with a variety of applications. But you can use it to outline and examine how the steps of a flawed process connect.

Made up of a few simple symbols linked with arrows indicating workflow direction, flowcharts clearly illustrate what happens at each stage of a process – and how each event impacts other events and decisions.
3. Strategy maps
Frequently used as a strategic planning tool, strategy maps also work well as problem mapping diagrams. Based on a hierarchal system, thoughts and ideas can be arranged on a single page to flesh out a potential resolution.

Once you’ve got a few tactics you feel are worth exploring as possible ways to overcome a challenge, a strategy map will help you establish the best route to your problem-solving goal.
Problem solving mind maps
Problem solving mind maps are especially valuable in visualization. Because they facilitate the brainstorming process that plays a key role in both root cause analysis and the identification of potential solutions, they help make problems more solvable.
Mind maps are diagrams that represent your thinking. Since many people struggle taking or working with hand-written or typed notes, mind maps were designed to let you lay out and structure your thoughts visually so you can play with ideas, concepts, and solutions the same way your brain does.
By starting with a single notion that branches out into greater detail, problem solving mind maps make it easy to:
- Explain unfamiliar problems or processes in less time
- Share and elaborate on novel ideas
- Achieve better group comprehension that can lead to more effective solutions
Mind maps are a valuable problem solving tool because they’re geared toward bringing out the flexible thinking that creative solutions require. Here are three types of problem solving mind maps you can use to facilitate the brainstorming process.
4. Mental maps
A mental map helps you get your thoughts about what might be causing a workplace issue out of your head and onto a shared digital space.

Because mental maps mirror the way our brains take in and analyze new information, using them to describe your theories visually will help you and your team work through and test those thought models.
5. Idea maps

Idea maps let you take advantage of a wide assortment of colors and images to lay down and organize your scattered thought process. Idea maps are ideal brainstorming tools because they allow you to present and explore ideas about the best way to solve a problem collaboratively, and with a shared sense of enthusiasm for outside-the-box thinking.
6. Concept maps
Concept maps are one of the best ways to shape your thoughts around a potential solution because they let you create interlinked, visual representations of intricate concepts.

By laying out your suggested problem-solving process digitally – and using lines to form and define relationship connections – your group will be able to see how each piece of the solution puzzle connects with another.
Problem solving software solutions
Problem solving software is the best way to take advantage of multiple problem solving tools in one platform. While some software programs are geared toward specific industries or processes – like manufacturing or customer relationship management, for example – others, like MindManager , are purpose-built to work across multiple trades, departments, and teams.
Here are three problem-solving software examples.
7. Layered process audit software
Layered process audits (LPAs) help companies oversee production processes and keep an eye on the cost and quality of the goods they create. Dedicated LPA software makes problem solving easier for manufacturers because it helps them see where costly leaks are occurring and allows all levels of management to get involved in repairing those leaks.
8. Charting software
Charting software comes in all shapes and sizes to fit a variety of business sectors. Pareto charts, for example, combine bar charts with line graphs so companies can compare different problems or contributing factors to determine their frequency, cost, and significance. Charting software is often used in marketing, where a variety of bar charts and X-Y axis diagrams make it possible to display and examine competitor profiles, customer segmentation, and sales trends.
9. MindManager
No matter where you work, or what your problem-solving role looks like, MindManager is a problem solving software that will make your team more productive in figuring out why a process, plan, or project isn’t working the way it should.
Once you know why an obstruction, shortfall, or difficulty exists, you can use MindManager’s wide range of brainstorming and problem mapping diagrams to:
- Find the most promising way to correct the situation
- Activate your chosen solution, and
- Conduct regular checks to make sure your repair work is sustainable
MindManager is the ultimate problem solving software.
Not only is it versatile enough to use as your go-to system for puzzling out all types of workplace problems, MindManager’s built-in forecasting tools, timeline charts, and warning indicators let you plan, implement, and monitor your solutions.
By allowing your group to work together more effectively to break down problems, uncover solutions, and rebuild processes and workflows, MindManager’s versatile collection of problem solving tools will help make everyone on your team a more efficient problem solver.
Download a free trial today to get started!
Ready to take the next step?
MindManager helps boost collaboration and productivity among remote and hybrid teams to achieve better results, faster.
Why choose MindManager?
MindManager® helps individuals, teams, and enterprises bring greater clarity and structure to plans, projects, and processes. It provides visual productivity tools and mind mapping software to help take you and your organization to where you want to be.
Explore MindManager

Do you have a Problem that Needs Solving Quickly?

Rapid Problem Solving is an extremely useful tool that gives us a systematic approach to dealing with day to day issues and problems that arise in every organisation. The key to success with Rapid Problem Solving is using a collaborative approach thus ensuring collective learnings. Here you will find a “ How to ” guide to solve 80% of problems.
The Rapid Problem-Solving Process:
The Rapid Problem Solving Process has 4 key Steps:
- Define & Investigate the problem
- Brainstorm potential Causes
- Root Cause Analysis
- Identify Solutions & Assign Countermeasures
IMPORTANT: Use a Standardised template to navigate through the process. To download Rapid Problem Solving template, click here .

The Scenario

Most of you will recognise, both this visual and have experienced this within our professional lives. Let’s take a closer look with Rapid Problem Solving .
1. Define the Problem & Investigate:
- What is Occurring?
- Where is it Occurring?
- When did it Occur?
- Impact of Problem?
Example: “From Jan 1 to May 5 th , the average time to deliver rocks is 5 hours from A to B, which is 2 hours above the target. This is occurring with all Type ZX Model transportation and is extending the delivery date of the pyramid by 5 months, resulting in a very dissatisfied customer.

2. Brainstorm Potential Causes:
Using the Fishbone Diagram to capture and organise the teams brainstorming ideas on potential causes
Direct Causes – The event that directly caused the symptom
Contributing Causes – Reasons that contributed to the problem, but on its own did not cause the problem
Root Causes – Reason for the problem, which if taken away can prevent recurrence
Direct Cause : Not possible to push 20 rocks with current number of people
Contributing Causes: Barrow sinking in sand, Moving barrow during the hottest sun
Root Cause: Incorrect wheel design

4. Root Cause Anaylsis
Use the 5-Whys process to help you drill down to the root cause once you have all the inputs/cause established on the fishbone.
Sometimes you may need to use less or more than 5 Whys!
Cause: Incorrect wheel design
First Why: Why is the wheel designed incorrectly?
The design process considered one design for wheel
Second Why: Why does the process consider only one design?
There is no requirement to consider other designs in the process
Summary : Real root cause is within the Design Process

4. Identify Solutions & Assign Countermeasures
What types of countermeasure can we use?
Containment/ Immediate action – Action that will contain the problem immediately (Sticky Plaster!)
Corrective Action – Action that will prevent the immediate reoccurrence of the problem
Preventative Action – Action that will prevent the re occurrence of the problem FOREVER!

Direct Cause : Not enough people to push rocks
Immediate Action:
Option 1: Add more people to push the barrow
Option 2: Reduce number of rocks on load and increase number of rock deliveries
Root Cause :
- Incorrect wheel design
- Limitations within the Design Process
Preventative Action:
- Redesign wheel to move barrow quicker and with a better material for sand application
- Update the Design Process to include a minimum of 3 concept designs
Levels of Counter Measures:
The higher you go on the pyramid the better the Countermeasure will be. The ideal is to prevent the occurrence of the error, for example, the three-pin plug.
However, sometimes it may not be practical or economically viable to install physical solutions. As always, a risk-based approach should be used, and common sense must prevail!

To find out more, click on the link below.
Alternatively please contact Clodagh at [email protected]

Crystal Lean Solutions is proudly powered by WordPress
Privacy Overview
Content Goes here
Key Business Challenges and Project Objectives:
Our Engineering Services client has a functional structure and found it challenging to ship on time, consistently. From an analysis, a number of issues were identified preventing shipments on time. One area identified was a lack of communication across the functions, resulting in shipments not meeting delivery requirements. CLS were invited to mentor the team on Visual Management as a possible improvement to managing shipments. The key objectives of this project were:
- Design and implement a Visual Management System to support On Time shipments to customer
- Improve On Time Delivery from 60% to 75%
CLS Approach and Changes Implemented:
CLS worked with the Project Team, starting with identification of the customers of the Shipment process and understanding their requirements, using a SIPOC. A list of 65 requirements were identified initially. The 65 items were prioritised and reduced to 8 critical requirements. Next the key information required to meet customer requirements were identified and who can provide this data. The team communicated these requirements to the relevant people and confirmed how frequently the information was required and in what format. On completion on the SIPOC, the following actions were implemented over a two-month timeframe with minimal investment:
- Designed a Shipment Board with the key elements of information identified on the Board
- Identified colour coding to identify what elements were on target for shipment (green) and what elements were not on target (red)
- Designed a process to implement actions for Red items
- Completed training and Piloted the process
- Updated board design from Pilot
Results / Outcomes:
- Designed and Implemented a Visual Management System to manage shipments.
- Engaged the functions to work effectively together and reducing stress associated with shipments for people involved.
- Improved On Time Delivery from 60% to 80%.

Problem Solving Tools Templates
Solve problems effectively with visual thinking tools, visual problem solving templates to help analyze problems from different perspectives and find optimal solutions..
- Powerful visualization capabilities break complex challenges into simple components
- Collaborate with your team to analyze root causes and find solutions
- Evaluate alternative solutions and identify the optimal one to implement

Unlock Creativity and Out of the Box Thinking
Infinite canvas that scales up to 1000s of items in a single view to enable visual problem-solving.
Multiple problem solving templates such as the 5 whys analysis, cause and effect diagram, mind maps and fishbone diagrams to conduct in-depth analysis of problems and determine effective solutions.
Powerful documentation capabilities to maintain comprehensive documentations of solutions.
Go From Idea to Execution

Collaborate with team members and other stakeholders by sharing workspaces with an email invite or a link to brainstorm ideas together.
Always in sync. Get updated about all changes made to a workspace even if you go offline.
10,000+ professional shape libraries can be used to identify the most effective template to identify the solution.
Visually arrange data shapes in grids, Kanban boards, timelines, action plans and more to manage workflows when implementing solutions.
Export as PDF, SVG and PNG, JPEG of the solutions you identified for the existing problem.

Connect Processes, Workflows and Teams
Transfer content ownership when offboarding users to refer and come up with suggestions where necessary, if solutions need to be changed.
Search for images from the web and easily add them to the canvas to create comprehensive visualizations and conduct detailed analyses.
Version history to keep track of all the changes made to a workspace and divert to an earlier version when necessary.
Use frames inside the infinite canvas to generate pages like layouts, group content or build a presentation flow based on your problem and solutions.

What Is Problem Solving?
Problem-solving is the process of defining a problem, identifying its root causes, finding an optimal solution and deciding the corrective actions that need to be taken.
How to Conduct Visual Problem Solving?
- Identify what the issue is and define it. Correctly defining the problem is necessary to come up with the right and relevant solutions.
- Understand and consider the interests of your stakeholders. Any solution you choose should satisfy the interests of all parties involved.
- Dig deeper and determine what is causing the defined problem. You can use the 5 whys analysis or the cause and effect analysis to identify the root causes.
- If your team involves remote employees, invite them to collaborate on your diagram and help find causes with a secure link to share your workspace.
- Brainstorm to find possible solutions. You can use a mind map for this exercise.
- Evaluate the solutions you ideated by considering the pros and cons. Accordingly, determine the best solutions.
- Once the solution is selected, create an action plan defining the actions steps you need to take and the timeline. After you deploy the action plan, monitor the results and do modifications.
- You can share the diagrams you have created in company wikis, websites or blogs using the Creately Viewer. You can also quickly download them as images, SVGs or PDFs for presentations and other documents.
The Ultimate Guide to Problem Solving Tools
- Ossian Muscad
- March 10, 2022
- No Comments

Last Updated on February 29, 2024 by Ossian Muscad
Every business, regardless of its industry, encounters the inevitable challenge of problem-solving. This critical aspect of business operations is often multifaceted, whether it’s in the process of anticipating potential obstacles, addressing immediate issues at hand, or refining systems for improved efficiency. The intricate and often time-intensive nature of solving these problems demands not only a systematic approach but also the right set of tools to navigate the complexities effectively.
Problem-solving tools are, therefore, not just useful but essential for any business professional. This guide delves into the intricacies of these tools, equipping you with the necessary understanding and skills to employ them within your organizational context. From the nuances of selecting the appropriate tool for a specific challenge to the strategic implementation for maximum impact, we offer a comprehensive exploration into the world of problem-solving tools designed to streamline and enhance your decision-making processes.
What are Problem Solving Tools?
Problem-solving tools are structured methodologies or frameworks designed to aid individuals and organizations in navigating the complexities of various challenges. They offer a systematic way to deconstruct and comprehend issues, thereby empowering you to tackle each component with clarity and strategic insight. These tools serve as a kind of compass in the intricate maze of decision-making, providing a step-by-step guide to dissect problems and identify their underlying causes.
By enabling focused brainstorming, these methodologies help in the generation and assessment of potential resolutions, ensuring that the execution of solutions is not only strategic but also monitored for effectiveness. Diverse in their application, problem-solving tools adapt to a range of scenarios, each with its distinct intricacies and nuances. They encourage a proactive approach to conflict resolution, fostering a mindset geared towards continual improvement and preemptive action.
Utilizing visual aids like charts or diagrams, these tools can chart the most efficient path from a problem-ridden present to a solution-oriented future, mapping out the journey from dysfunction to functional success in a clear and accessible manner.
Common Problem Solving Tools and Diagrams
A visual problem-solving process will help reinforce your understanding of the issue and is an excellent way for you and your team to convert abstract ideas into an actual, reconstructive plan. With that said, here are six examples of common problem-mapping diagrams that you can try:
Fishbone Diagram
The Fishbone Diagram , also known as the Cause-and-effect Diagram or the Ishikawa diagram , is a powerful problem-solving tool that visually maps out the potential causes of an issue. Its distinctive shape resembles the skeleton of a fish, where the “head” represents the problem and the “bones” branching out from the “spine” symbolize different categories of root causes.
Each of these categories, such as Methods, Equipment, People, and Materials, is probed to identify possible contributing factors to the problem at hand. The simplicity and effectiveness of the Ishikawa diagram lie in its ability to facilitate comprehensive brainstorming sessions based on the principle of cause and effect.
With its widespread popularity, teams across industries value this type of diagram for its ease of use and its competence in stimulating the identification and analysis of various potential causes for a problem. Fishbone diagrams are versatile tools that can be applied in numerous situations. Here’s a comprehensive list detailing common uses:
- Root Cause Analysis in Manufacturing : Identifying the root causes of defects or product quality issues, often drilling down to factors in the production process.
- Service Industry Problem-Solving : Pinpointing causes of customer complaints or service bottlenecks, leading to more effective service delivery.
- Healthcare Error Analysis : Analyzing medical errors or healthcare process inefficiencies, aiming to improve patient care and safety.
- Product Development : Exploring potential issues in new product design and development phases, ensuring all possible flaws are addressed.
- Business Process Improvement : Examining processes within a business to identify inefficiencies or recurrent problems, which can then be systematically eliminated.
- Marketing Analysis : Understanding complex challenges within marketing campaigns, such as low engagement rates or poor customer feedback.
- Human Resources Issues : Addressing issues relating to staff, such as absenteeism, low morale, or high turnover, with an aim to enhance employee satisfaction and retention.
Flowcharts are among the most prevalent and straightforward problem-solving tools utilized across various industries due to their visual representation of processes or systems. They consist of shapes and arrows that designate sequential steps, illustrating the flow from one stage to another. This visual mapping allows individuals and teams to follow a problem from initiation to resolution, providing a bird’s-eye view of the entire process.
The primary advantage of employing a flowchart lies in its capacity to lay out each step in a predictable manner, thereby enabling the observer to identify bottlenecks, redundancies, or inefficiencies within any step. By using flowcharts, you can dissect complex processes into manageable parts, ensuring a more precise understanding of how each component interacts with others.
This comprehensive perspective not only aids in pinpointing where the issues arise but also enhances the potential for optimizing different segments of the workflow to achieve a more efficient, streamlined process. Flowcharts are a universal tool used to break down complex processes and illustrate step-by-step sequences. Common uses for flowcharts that span across various disciplines include, but are not limited to:
- Process Documentation : For capturing and communicating the steps involved in a process within an organization, ensuring consistency and clarity.
- Troubleshooting Guides : A diagnostic tool to guide users through a series of decisions to resolve a problem or understand a complex scenario.
- Operational Improvement : To identify inefficiencies or bottlenecks in operational processes and pinpoint areas for improvement or simplification.
- Educational Tool : Utilized in teaching to explain complex topics in a visual, step-by-step manner that is easier for students to follow and understand.
- Decision Making : Aids individuals and businesses by mapping out the possible routes and outcomes of a decision, making the decision-making process clearer and more informed.
- Quality Management : Helps in ensuring compliance with quality standards by outlining the process flow and establishing critical control points.
- System Design : In systems engineering, it represents the interactions and flow between various system components or subsystems.
- Project Management : Project managers often use flowcharts to plan and monitor the stages of a project, ensuring that each phase transitions smoothly into the next.
Strategy Maps
Strategy Maps are a frequently used tool for strategic planning within companies, but they also hold significant value in problem-solving tasks. The essence of a strategy map is to illustrate the connections among various aspects of the organization, such as objectives, measures, initiatives, and activities. These diagrams provide a visual representation of how each component supports the overarching goals and serve as a guide to understanding which areas require attention in order to solve a problem. There are three main types of strategy maps:
- Cause-and-effect maps : Demonstrating the relationships between different strategic objectives. Each objective is linked by arrows that show how one influences another, creating a network of cause-and-effect connections.
- Objective Maps : Focused on detailing the primary objectives of the organization and outlining the necessary measures and initiatives to achieve each one.
- Balanced Scorecard Maps : They correspond to the Balanced Scorecard framework and display the organization’s strategy balanced across four perspectives: Financial, Customer, Internal Processes, and Learning & Growth.
While each type of map has its specific applications and nuances, the underlying premise remains constant: to provide a comprehensive view of the strategic interdependencies within an organization. In doing so, strategy maps facilitate the identification of areas where resources can be optimized or where shifts in strategy may resolve existing problems.
Strategy Maps enable leaders and teams to align their efforts toward a common goal and to comprehend how changes in one segment of the business can ripple through and impact the organization as a whole. Strategy Maps are incredibly versatile and can be applied to a number of uses within an organization to enhance strategic understanding and alignment. Below is a detailed list of the common uses of Strategy Maps:
- Vision and Strategy Communication : Strategy Maps articulate an organization’s vision and strategy across various levels, ensuring all employees understand how their roles contribute to the broader objectives.
- Aligning Initiatives : They align projects and initiatives with strategic objectives, ensuring that each effort is coherent with the overall direction of the company.
- Performance Analysis : These maps facilitate performance measurement against strategic goals, allowing companies to track progress and make informed adjustments.
- Business Unit Synchronization : They offer a holistic view that aids in synchronizing efforts across different business units or departments, fostering an integrated approach to achieving strategic goals.
- Strategic Discussion and Decision Making : Strategy Maps stimulate discussion among executives and managers, providing a framework for strategic decision-making and problem-solving.
- Identifying and Closing Gaps : They help identify gaps in strategy execution and provide a structured way of developing initiatives to close those gaps.
- Facilitating Strategy Review and Planning Sessions : Strategy Maps are used during strategy review meetings and planning sessions to reflect on strategic performance and plan for future periods.
The 5 Whys is a problem-solving method developed by Sakichi Toyoda and later used within Toyota Motor Corporation during its manufacturing process improvements. It is a simple yet effective technique used to uncover the root cause of a problem by asking “Why?” a minimum of five times or until the underlying issue is identified.
The process involves a team collaboratively pinpointing an issue and then questioning the cause of that issue iteratively. This exercise forces deeper inquiry beyond surface-level symptoms, leading to the discovery of the fundamental problem at hand. By addressing the root cause, organizations can implement substantive, long-term solutions rather than temporary fixes.
The 5 Whys technique is versatile and can be applied in various industries and scenarios, making it a staple in the toolbox of lean manufacturing, quality management, and process improvement. The 5 Whys technique has a multitude of applications across different fields and industries due to its simplicity and effectiveness in root cause analysis. Here is a comprehensive list detailing seven common uses of the 5 Whys:
- Problem-Solving in Manufacturing : Applied to identify the root cause of defects or production issues, contributing to improved product quality and process optimization.
- Safety Incident Analysis : Used to dissect the series of events leading to a safety incident, allowing organizations to implement measures that prevent future occurrences.
- Healthcare Error Reduction : Helps in understanding the underlying causes of errors in medical procedures or patient care, aiming to enhance patient safety and care quality.
- IT Troubleshooting : Assists in diagnosing the core issues in IT service disruptions or system failures, ensuring more reliable and efficient technological infrastructures.
- Business Process Improvement : Employs the technique to delve into inefficiencies or bottlenecks in business operations, resulting in streamlined processes and reduced operational costs.
- Customer Experience Enhancement : Identifies the fundamental reasons behind customer complaints or dissatisfaction, leading to better service and elevated customer satisfaction levels.
- Environmental Sustainability : Applied to analyze the root causes of environmental impact within an operation, informing strategies for more sustainable business practices.
Pareto Charts
Pareto charts are statistical tools named after the Italian economist Vilfredo Pareto, who is best known for the Pareto Principle. This principle, also known as the 80/20 rule, posits that for many events, roughly 80% of the effects come from 20% of the causes. A Pareto Chart conveys this concept through a visual graph that combines both bar and line graphs.
The bars represent individual values in descending order from left to right and are typically related to frequency or cost. Next to these, a line graph indicates the cumulative total, enabling users to easily identify which factors contribute the most to the problem they are examining. Pareto Charts are especially useful in quality control and process improvement because they help stakeholders prioritize issues or defects in a process.
By concentrating efforts on the most significant problems, organizations can significantly improve their overall performance, often with considerably less effort than by treating all problems equally. Pareto Charts are widely recognized for their ability to visually represent and prioritize problems to focus improvement efforts. Here are seven common uses of Pareto Charts across various disciplines:
- Quality Control in Manufacturing : Helps identify the most frequent defects or errors in the manufacturing process, allowing prioritization and allocation of resources to tackle the issues that will have the greatest impact on quality improvement.
- Customer Feedback Analysis : By categorizing and ranking customer complaints or feedback, businesses can focus on resolving the problems that affect the largest number of customers or those that have the most severe impact on customer satisfaction.
- Inventory Management : The use of Pareto Charts can highlight the small proportion of items that often constitute the bulk of an inventory’s value, enabling better stock optimization and cost savings.
- Sales Analysis : Assists companies in determining their most profitable products or services, as well as their most valuable customers, thus guiding more effective sales and marketing strategies.
- Health and Safety : Identifies the most common causes of accidents or health incidents in the workplace, leading to targeted interventions that can improve worker safety and reduce the risk of future incidents.
- Operational Bottlenecks : Pinpoints the few critical bottlenecks in operational processes that cause the majority of delays or inefficiencies, allowing for focused process improvement efforts.
- Financial Analysis : Enables businesses to target the most significant cost drivers or the areas where spending is greatest, promoting more strategic financial management and cost reduction measures.
Decision Trees
A decision tree is a flowchart-like structure that is used as a decision support tool, representing a series of decisions and their possible consequences, including chance event outcomes, resource costs, and utility. It’s a visual representation that maps out multiple decision paths and evaluates them based on various scenarios, which can be immensely beneficial in making informed choices in complex situations.
Decision trees feature branches that depict decision nodes and leaf nodes representing outcomes, allowing individuals or organizations to review all possible solutions and identify the best course of action before committing. This analytical tool is widely used across business, engineering, law, and medical fields due to its straightforward graphical approach, which promotes clarity in the decision-making process.
Decision Trees are versatile tools, and their application can be found in diverse areas. By exploring different scenarios and their potential outcomes, you can uncover hidden insights and make more informed decisions. Here are some common uses of Decision Trees:
- Strategic Business Decisions : Enables businesses to visually map out various strategic choices and assess potential outcomes and risks, leading to well-informed decisions.
- Project Management : Assists managers in anticipating potential project challenges and outcomes, allowing for proactive mitigation strategies and better allocation of resources.
- Finance and Investment : Used by investors to evaluate different investment opportunities and scenarios, aiding in the risk assessment and decision-making process.
- Operations Research : Helps determine optimal operational decisions based on various conditional and probabilistic scenarios, improves efficiency, and reduces costs.
- Marketing Analysis : Allows marketers to understand customer behavior and segment markets, facilitating targeted marketing campaigns and customer relationship management.
- Medical Diagnosis and Treatment Planning : Helps healthcare providers in assessing the probability of diseases based on symptoms and deciding on the best treatment plans.
- Machine Learning and Data Mining : Provides algorithms that assist in classification and regression tasks, making predictions based on data patterns.
Objective Map
An objective map is a strategic tool utilized by companies to visualize their objectives and the connections between them. This graphical illustration aids in clarifying how various goals relate to one another and often reveals how addressing one objective can influence the achievement of others.
By mapping out objectives in a clear and structured way, an objective map enables team members and stakeholders to gain insight into the hierarchy and interdependencies of their collective goals. It’s particularly valuable when trying to solve complex problems within an organization, as it helps to pinpoint which objectives need to be prioritized and tackled in order to address and resolve specific challenges effectively.
This visual mapping can become a critical step in strategic planning, ensuring that efforts are directed toward the most impactful areas. Objective Maps are crucial in a multitude of organizational processes. Here are seven common uses:
- Strategic Planning : Assists organizations in identifying their primary goals and exploring secondary objectives that support them. By understanding the impact and relationship between different aims, companies can better allocate resources to critical areas.
- Performance Management : Helps translate organizational goals into employee performance metrics, ensuring individual objectives are aligned with the company’s vision and mission.
- Process Improvement : Provides a framework to identify processes that are directly tied to strategic goals, which can be optimized for better efficiency and results.
- Product Development : Clarifies the objectives surrounding a product’s features, market fit, and customer needs, making it a valuable tool in prioritizing development milestones.
- Change Management : Aids in visualizing the objectives tied to organizational change, helping stakeholders see the bigger picture and the key goals that change initiatives support.
- Resource Allocation : By clarifying which objectives are most critical, Objective Maps guide decision-makers in allocating budget, personnel, and other resources more effectively.
- Risk Management : Facilitates the identification of goals that could be impacted by potential risks, allowing for a proactive approach to mitigating threats to the organization’s objectives.
Balanced Scorecard Map
A Balanced Scorecard Map is a strategic planning and management tool that provides a visual representation of an organization’s performance measures and objectives across different perspectives. It brings together financial, customer, internal, and growth-related goals in a coherent manner, articulating how the organization creates value.
By identifying key performance indicators (KPIs) and targets within these areas, the map serves as a guide to translate a company’s vision into actionable goals. It allows managers and teams to understand at a glance how various objectives tie into overall corporate strategy and how they contribute to resolving organizational issues.
With its clear, graphical design, a Balanced Scorecard Map can highlight specific areas that require attention to drive improvement and achieve strategic balance. Balanced Scorecard Maps are used widely across various industries to enhance strategic alignment and improve organizational performance. Here is a comprehensive list detailing their common uses:
- Strategic Alignment & Execution : Aligns the day-to-day work that everyone is doing with strategy, making sure that projects, initiatives, and daily activities all move in the same direction as the organization’s strategic objectives.
- Performance Measurement : Goes beyond financial metrics to include valuable KPIs concerning customers, internal processes, and learning and growth, thus providing a more ‘balanced’ view of organizational performance.
- Communication of Strategy : Acts as a vehicle to communicate the organization’s strategy internally and externally clearly and concisely, ensuring that everyone understands the strategic priorities and how their roles impact them.
- Linking Rewards to Performance Metrics : Ties performance management to KPIs and strategic goals, which can inform compensation and reward systems that motivate employees to support and achieve these goals.
- Strategic Feedback & Learning : Provides a structured feedback system for monitoring, analyzing, and reviewing strategic performance and results, promoting continuous improvement and strategic learning within the organization.
- Prioritization of Projects & Investments : Helps prioritize projects and investments based on how they align with and impact strategic objectives, ensuring that resources are allocated to the most strategically relevant initiatives.
- Organizational Development & Change Management : Facilitates organizational growth and adaptation by linking change management initiatives to long-term strategic objectives, helping manage transformation and development in a strategic context.
No matter what type of problem you’re facing, there’s a diagram that can help you solve it. Therefore, by understanding the different types of diagrams and how to use them, you’ll need to prepare for any issue that comes your way.
How to Choose the Ideal Problem-Solving Tool?
Choosing the ideal problem-solving tool largely depends on the nature of the problem and its complexity. Here are some steps you can follow to select the most suitable tool:
- Define the Problem: Before you choose a tool, you need to understand the problem clearly. What is the issue you’re trying to solve? What are its effects?
- Identify the Nature of the Problem: Is the problem simple, complicated, or complex? Simple problems have predictable solutions, while complicated ones may require expert knowledge or detailed analysis. Complex problems involve many interconnected parts and are best approached by understanding those connections and their effects.
- Consider the Level of Analysis Required: Some problems can be solved with a simple root cause analysis . In contrast, others may require more in-depth analysis, such as a SWOT or PESTEL analysis.
- Identify the Resources Available: Some tools require specific resources or software. Ensure you have access to these resources before choosing a tool.
- Consider Your Team’s Familiarity with the Tool: If your team is already familiar with a particular tool, it might be advantageous to use it. If not, you’ll need to consider whether there will be a learning curve and if sufficient time and resources are available for training.
- Evaluate the Tool: Once you have chosen a tool, use it to solve the problem. Then, evaluate the effectiveness of the tool. Did it help solve the problem? Was it easy to use? Did it save time and resources?
The goal is not just to solve the problem but to learn from the process. This learning can be applied to future problem-solving efforts, continuously improving your approach.
Frequently Asked Questions (FAQs)
Q1: what differentiates a simple problem from a complex one in problem-solving.
Simple problems usually have a clear and predictable solution, whereas complex problems have many interconnected components that change dynamically and may require holistic and flexible approaches to solve. By understanding the nature of the problem, you can choose a suitable tool for effective problem-solving.
Q2: How frequently should I review and update the problem-solving tools used in my organization?
Review and update your problem-solving tools as needed when there is a significant change in the organization’s objectives or market conditions or when feedback or results indicate an improvement is warranted. Make sure your tools are aligned with your current strategy and goals to ensure their effectiveness.
Q3: Can one problem-solving tool be used for all types of problems?
Not typically. Problem-solving tools are varied and designed to address specific types of issues. It’s crucial to match the right tool to the problem to ensure an effective solution. At the same time, some tools may be adaptable and useful for multiple types of problems.
Q4: What should I do if a selected problem-solving tool does not yield the expected results?
If the tool isn’t working, it’s essential to re-evaluate the situation, possibly redefining the problem or choosing a different tool that may be better suited to the circumstances. That way, you can find a solution that is more likely to yield the expected results. If necessary, seek guidance or assistance from experts in the field to help identify a suitable tool and approach.
Q5: Is collaboration always beneficial when using problem-solving tools?
Collaborative problem-solving can foster diverse ideas and lead to innovative solutions. However, the situation and type of problem should guide the necessity and extent of collaboration. By understanding these factors, you can choose the most effective problem-solving approach and tool for your organization’s needs.
Q6: How important is it to be trained in multiple problem-solving tools?
Proficiency in various tools allows for flexibility and adaptability in tackling different problems. Continuous learning and training in multiple methodologies can significantly improve problem-solving effectiveness. Making sure your team is well-versed in various tools can also increase their confidence and competence in addressing complex issues. So, it’s beneficial to invest in training and development programs that expose individuals to a variety of problem-solving approaches and tools.
Streamline Problem-Solving Processes with DATAMYTE
DATAMYTE is a quality management platform with low-code capabilities. Our Digital Clipboard , in particular, is a low-code workflow automation software that features a workflow, checklist, and smart form builder. This tool lets you build and deploy custom solutions for problem-solving, quality control, data collection, and analysis without any programming knowledge.
DATAMYTE also lets you conduct layered process audits, a high-frequency evaluation of critical process steps, focusing on areas with the highest failure risk or non-compliance. Conducting LPA with DATAMYTE lets you effectively identify and correct potential defects before they become major quality issues.
With DATAMYTE , you have an all-in-one solution for efficient and effective problem-solving, quality management, and continuous improvement. Book a demo now to learn more.
The art of problem-solving necessitates a careful evaluation of the problem, consideration of the tools and resources available, and a sound understanding of your organization’s capabilities. Whether the problem at hand is simple, complicated, or complex, the key lies in matching the right problem-solving tool to the task.
Regular review and adaptation of tools, coupled with a readiness to embrace training and collaboration, bolsters the problem-solving process. Through an iterative and informed approach to problem-solving, it is possible to enhance decision-making, drive continuous improvement, and achieve strategic organizational goals.
Related Articles:
- How to Simplify Layered Process Audits
- Top 7 Best Calibration Management Software in 2024
- Implementation
- Case-Studies
- White Papers
- Knowledge Base
Experts in the Connected Factory

- 1-800-455-4359
- (763) 553-0455 ext. 1
- [email protected]
Problem Solving: Practical Tools and Techniques
Experiential Education

When solving problems, dig at the roots instead of just hacking at the leaves. Anthony J. D'Angelo
What will you learn?
- An introduction to problem solving
- The different stages of problem solving
- Tools and techniques for defining problems, finding causes, and coming up with solutions
- How to do an action plan
Introduction
Effective problem solving often requires you to collect, process, analyse and evaluate information to find a solution/s. Along with other transferable skills like communication, planning and organisation, teamwork, critical thinking, digital literacy, and active inquiry (for example), it is essential in work and life more generally.
There are a few different stages in the problem solving process, which makes it a little more complicated than it probably sounds. For example, you first have to define the problem, then collect more information about it and do some research and investigations into causes. After that, you need to process the material to understand it, and then analyse and evaluate it (whilst generating possible solutions along the way). The final solution/s and action plan then come from there.

Stages in the Problem Solving Process
There are various stages to problem solving. We have described those that we see as key in the process, starting with recognising the problem to begin with and defining and labelling it; through to solving it, evaluating it and planning for contingencies. In connection with this, we have introduced certain problem solving tools and techniques that can be used at each stage. This is because some methods work better at different stages than others. The methods are presented in more detail in the section following this one, titled ‘Tools of the Trade’.
So, what are the key stages in the problem solving process?
- Problem Recognition – determining what the problem is
- Labelling the problem
- Conducting a problem-cause analysis
- Optional solutions
- Making a decision based on the best options you have generated
- Developing an action plan to solve the problem
- Evaluating and monitoring your solution to the problem
- Contingency planning and resource examination

Problem Recognition
This first stage is where you identify the symptoms. You look for facts and analyse data, as well as explore history and human factors such as attitudes, values and reactions (soft data). Symptom identification can be achieved through collecting all kinds of data, including through interviews and focus groups, brainstorming and mind mapping. More on these methods can be found later in this module.
Define and label the Problem (and determine causes)It is important to have a clear definition of the problem otherwise the solutions generated will not work. This is because the solutions you come up with will not necessarily address the actual problem (i.e. ‘the real problem’ or ‘key stone’). For example, if you define the problem as being poor performance by employees, when in fact it is a lack of training or high expectations, the solutions generated to address the problem are unlikely to be effective.
In this stage, it is good to write down some problem statements. Begin by noting the problem and why it is important to solve. Consider the benefits to solving the problem (e.g. costs, consumer satisfaction, employee wellbeing, time, product quality).
Work out stakeholders (both internal and external) and who all the members of the team are. In regards to the problem, think through - who, what, where, when, how and why.
Find the root cause of the problem (do not be caught on symptoms otherwise you won’t find the real issue).
The tools we recommend to help you define the problem and determine the cause (including the root cause) are:
- The 5W’s (and the 5 WHY’s)
SWOT Analysis
Mind mapping, brainstorming.
- The Fishbone Diagram (or Cause and Effect Diagram)
Affinity Mapping
To explore some of these further, see below under ‘Tools of the Trade’.

Generate Ideas and Solutions
After defining the problem and finding the root cause, you need to generate ideas and solutions. This usually happens through brainstorming and mind mapping. These are good techniques for generating ideas quickly (and just getting it all down).
These methods help to generate thought not only around problem statements, definitions or causes (in stage one) but about potential solutions, impacts, and much more. These techniques are more concerned with ‘quantity’ in terms of getting as many ideas as possible, rather than ‘quality’. You can also do a force-field analysis in this stage or positive and negative analysis.
Students interested in watch in a lecture on critical thinking and problem solving in the context of agriculture can watch the following video:
Critical thinking and Problem solving | 19:08 mins
To explore brainstorming and mind mapping, please see below under ‘Tools of the Trade’.

Decide on the Best Solution
Once you have generated optimal solutions, you then need to make some decisions about what to choose. There are many decision-making tools that can be used. Some of these include:
- Brainstorming.
- Elimination – In business a process of elimination and selection of the best solution.
- Weighting of consequences – you can select as solution and then weigh up all the consequences or outcomes from that solution.
- Prioritising - You may have several solutions with good outcomes but you wish to select the best.

Take Action
Once you arrived at your solution to your problem, an action plan should be developed. Elements to include in your action plan could be a series of questions. There are no hard and fast rules on what to include in your action plan. However, it must be highly effective in solving the problem or problems. It must be well thought through, achievable and highly relevant to your business.
Some elements to include in your plan may be:
- What is to be done?
- How is it to be done?
- Who is responsible?
- When will it be done by?

This section of the module provides some detail on problem solving tools – and when to use them. Not all possible tools are described but we have tried to include those that are often used in business/enterprise.
The 5W’s and the 5 WHY’s
The 5W’s approach is most useful when defining the problem and then later on when identifying if more data or analysis is required.
In most cases, you can define a problem by noting:
SWOT analysis is a strategic planning tool that is used to generate information on which rigorous, logical, defendable decision can be based. As the diagram highlights, SWOT stands for Strengths, Weaknesses, Opportunities and Threats.

To complete a SWOT Analysis for your business/company/enterprise or workplace, start with asking the following questions:
- What advantages (e.g. location, resources, facilities, etc.) does your enterprise have?
- What do you do better than anyone else?
- What make your enterprise unique? (Think about costs, resources, facilities or geographical locations etc. you identified above.)
- In addition, view your strengths by placing yourself in your competitor’s shoes?
Weaknesses:
- What would you need to do to improve in your enterprise?
- What would you avoid doing in your enterprise or what to improve in your enterprises position?
- View your weaknesses, by placing yourself in your competitor’s shoes? What are your weaknesses?
- What aspects of your enterprise is costing you sales?
Opportunities:
- What are the best opportunities for your enterprise to improve?
- What are the future trends emerging in your industry, and how aware of these are you?
- These may be new technology and changes in markets internationally or nationally.
- Consumers consumption patterns may be changing based on perceived healthy, clean, safe, environmentally produced practices.
- Governments (international and domestic) may change policies related to your enterprise activities.
- Social patterns, population profiles, lifestyle changes and demographics etc. may change.
- Operating environments (Social, Economic, Environmental) in which your enterprise operates may be changing.
- What impediments, obstacles and barriers does your enterprise face in its operating environment?
- Are your competitors changing their practices and their mode of operation?
- Are the food safety, quality standards, or specifications under which your enterprise operates (work place health and safety, labour force costs and tax requirement etc.), or the products changing due to consumer demands or government policies locally, state wide, nationally and internationally?
- Is globalisation, communications and changes technology threatening your enterprises position to remain sustainable, viable and grow?
- Management of your enterprise (Human Resources, Material Resources, Financial Resources etc.)?
- What is your true economic situation (cash flows, capital investment, bad debts etc/)?
- What is your social standing and position in the industry?
- What is your environmental situation (pollution, chemical usage, fertiliser, irrigation etc.) and your industry position?
- What factors can seriously threaten your enterprise and threaten your operating practices?
To explore SWOT Analysis further (and to find blank templates to use) please follow this link to a module on SWOT Analysis
Mind mapping is an effective means to brainstorm and collect your thoughts. A mind map is a diagram that visually organises information and involves writing down a central theme/concept and thinking of new and related ideas which radiate out from the centre.
By focussing on key ideas written down in your own words and looking for connections between them, you can map knowledge in a way that will help you better understand and retain information.
To see an example from the contemporary issues and sustainability unit, look below. You will see a mind map by Dr Nissen of economic, environmental and social issues that enterprises may face (and various strategies and plans that can be used to sustainably manage these issues). The map shows you a way of viewing how to undertake the process. It is best to produce a mind map that is suited to your own agricultural enterprise.
Find more on Mind Mapping here including examples.
Brainstorming is a popular group problem-solving technique.
A desktop search of definitions of brainstorming revealed that it is typically referred to as a technique for:
- Group thinking sessions (where all ideas are collected)
- Stimulating creative thinking
- Spontaneous participation
- Group problem-solving (around a specific question or challenge)
- Generating new ideas or creative solutions (drawing on lateral thinking/thinking outside the box)
- Ensuring all ideas are captured and nothing is criticised or critiqued until the later analysis stage
If you are interested in exploring the method of brainstorming beyond this brief description, please follow this link to a short module on Brainstorming .
The Fishbone
A fishbone analysis is often useful for trying to organise information generated from a root cause analysis, brainstorming or mind mapping exercise. You input this information into a fishbone diagram i.e. a picture of a fish where you write the main problem in the head, then record causes in the spines. The best way to do this is to write the problem as a statement or question and then add to the backbones of the fish with potential causes. The picture below provides an example of what a fishbone diagram looks like.

For other examples and access to fishbone templates, please click here .
GoLeanSixSigma also have a great Excel tool for fishbone diagrams:
After you have undertaken the initial research on a topic, affinity mapping is a useful strategy to visualise and categorise this information. It is an effective and dynamic way of recording the qualitative and quantitative data you have collected such as on-site observations and interviews. The first step to affinity mapping involves documenting your findings on separate sticky notes, followed by grouping them according to topics (e.g. trends, challenges, themes) and then categorising them with headings. Be prepared to move your sticky notes around; affinity mapping is a dynamic process.

Pokars, S. 1989. Systematic Problem Solving and Decision Making. The Viability Group, Inc. USA.
Porter, M. E. 1979 How competitive forces shape strategy, Harvard Business Review, vol. 59, no. 2, pp. 137-145.
Porter, M. E. 2008. The five forces that shape strategy. Harvard Business Review, vol. 88, pp. 78-93
< https://globaldigitalcitizen.org/critical-thinking-skills-cheatsheet-infographic >.

35 problem-solving techniques and methods for solving complex problems

Design your next session with SessionLab
Join the 150,000+ facilitators using SessionLab.
Recommended Articles
A step-by-step guide to planning a workshop, how to create an unforgettable training session in 8 simple steps, 47 useful online tools for workshop planning and meeting facilitation.
All teams and organizations encounter challenges as they grow. There are problems that might occur for teams when it comes to miscommunication or resolving business-critical issues . You may face challenges around growth , design , user engagement, and even team culture and happiness. In short, problem-solving techniques should be part of every team’s skillset.
Problem-solving methods are primarily designed to help a group or team through a process of first identifying problems and challenges , ideating possible solutions , and then evaluating the most suitable .
Finding effective solutions to complex problems isn’t easy, but by using the right process and techniques, you can help your team be more efficient in the process.
So how do you develop strategies that are engaging, and empower your team to solve problems effectively?
In this blog post, we share a series of problem-solving tools you can use in your next workshop or team meeting. You’ll also find some tips for facilitating the process and how to enable others to solve complex problems.
Let’s get started!
How do you identify problems?
How do you identify the right solution.
- Tips for more effective problem-solving
Complete problem-solving methods
- Problem-solving techniques to identify and analyze problems
- Problem-solving techniques for developing solutions
Problem-solving warm-up activities
Closing activities for a problem-solving process.
Before you can move towards finding the right solution for a given problem, you first need to identify and define the problem you wish to solve.
Here, you want to clearly articulate what the problem is and allow your group to do the same. Remember that everyone in a group is likely to have differing perspectives and alignment is necessary in order to help the group move forward.
Identifying a problem accurately also requires that all members of a group are able to contribute their views in an open and safe manner. It can be scary for people to stand up and contribute, especially if the problems or challenges are emotive or personal in nature. Be sure to try and create a psychologically safe space for these kinds of discussions.
Remember that problem analysis and further discussion are also important. Not taking the time to fully analyze and discuss a challenge can result in the development of solutions that are not fit for purpose or do not address the underlying issue.
Successfully identifying and then analyzing a problem means facilitating a group through activities designed to help them clearly and honestly articulate their thoughts and produce usable insight.
With this data, you might then produce a problem statement that clearly describes the problem you wish to be addressed and also state the goal of any process you undertake to tackle this issue.
Finding solutions is the end goal of any process. Complex organizational challenges can only be solved with an appropriate solution but discovering them requires using the right problem-solving tool.
After you’ve explored a problem and discussed ideas, you need to help a team discuss and choose the right solution. Consensus tools and methods such as those below help a group explore possible solutions before then voting for the best. They’re a great way to tap into the collective intelligence of the group for great results!
Remember that the process is often iterative. Great problem solvers often roadtest a viable solution in a measured way to see what works too. While you might not get the right solution on your first try, the methods below help teams land on the most likely to succeed solution while also holding space for improvement.
Every effective problem solving process begins with an agenda . A well-structured workshop is one of the best methods for successfully guiding a group from exploring a problem to implementing a solution.
In SessionLab, it’s easy to go from an idea to a complete agenda . Start by dragging and dropping your core problem solving activities into place . Add timings, breaks and necessary materials before sharing your agenda with your colleagues.
The resulting agenda will be your guide to an effective and productive problem solving session that will also help you stay organized on the day!
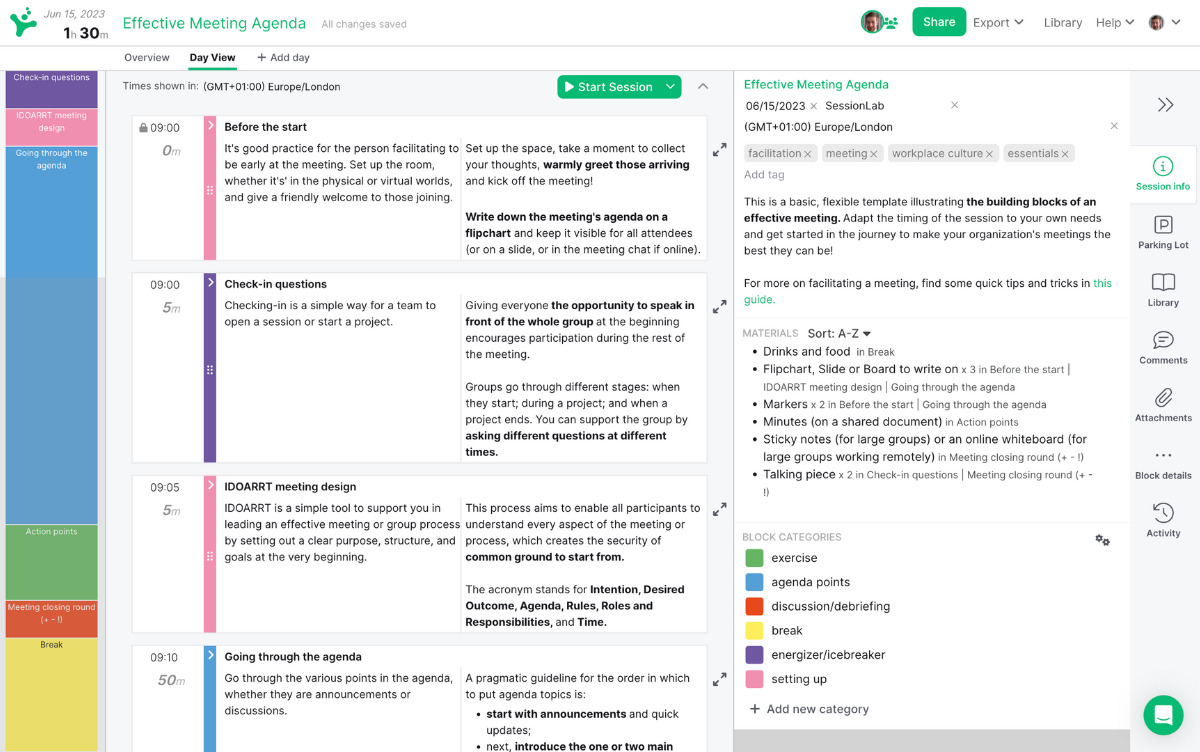
Tips for more effective problem solving
Problem-solving activities are only one part of the puzzle. While a great method can help unlock your team’s ability to solve problems, without a thoughtful approach and strong facilitation the solutions may not be fit for purpose.
Let’s take a look at some problem-solving tips you can apply to any process to help it be a success!
Clearly define the problem
Jumping straight to solutions can be tempting, though without first clearly articulating a problem, the solution might not be the right one. Many of the problem-solving activities below include sections where the problem is explored and clearly defined before moving on.
This is a vital part of the problem-solving process and taking the time to fully define an issue can save time and effort later. A clear definition helps identify irrelevant information and it also ensures that your team sets off on the right track.
Don’t jump to conclusions
It’s easy for groups to exhibit cognitive bias or have preconceived ideas about both problems and potential solutions. Be sure to back up any problem statements or potential solutions with facts, research, and adequate forethought.
The best techniques ask participants to be methodical and challenge preconceived notions. Make sure you give the group enough time and space to collect relevant information and consider the problem in a new way. By approaching the process with a clear, rational mindset, you’ll often find that better solutions are more forthcoming.
Try different approaches
Problems come in all shapes and sizes and so too should the methods you use to solve them. If you find that one approach isn’t yielding results and your team isn’t finding different solutions, try mixing it up. You’ll be surprised at how using a new creative activity can unblock your team and generate great solutions.
Don’t take it personally
Depending on the nature of your team or organizational problems, it’s easy for conversations to get heated. While it’s good for participants to be engaged in the discussions, ensure that emotions don’t run too high and that blame isn’t thrown around while finding solutions.
You’re all in it together, and even if your team or area is seeing problems, that isn’t necessarily a disparagement of you personally. Using facilitation skills to manage group dynamics is one effective method of helping conversations be more constructive.
Get the right people in the room
Your problem-solving method is often only as effective as the group using it. Getting the right people on the job and managing the number of people present is important too!
If the group is too small, you may not get enough different perspectives to effectively solve a problem. If the group is too large, you can go round and round during the ideation stages.
Creating the right group makeup is also important in ensuring you have the necessary expertise and skillset to both identify and follow up on potential solutions. Carefully consider who to include at each stage to help ensure your problem-solving method is followed and positioned for success.
Document everything
The best solutions can take refinement, iteration, and reflection to come out. Get into a habit of documenting your process in order to keep all the learnings from the session and to allow ideas to mature and develop. Many of the methods below involve the creation of documents or shared resources. Be sure to keep and share these so everyone can benefit from the work done!
Bring a facilitator
Facilitation is all about making group processes easier. With a subject as potentially emotive and important as problem-solving, having an impartial third party in the form of a facilitator can make all the difference in finding great solutions and keeping the process moving. Consider bringing a facilitator to your problem-solving session to get better results and generate meaningful solutions!
Develop your problem-solving skills
It takes time and practice to be an effective problem solver. While some roles or participants might more naturally gravitate towards problem-solving, it can take development and planning to help everyone create better solutions.
You might develop a training program, run a problem-solving workshop or simply ask your team to practice using the techniques below. Check out our post on problem-solving skills to see how you and your group can develop the right mental process and be more resilient to issues too!
Design a great agenda
Workshops are a great format for solving problems. With the right approach, you can focus a group and help them find the solutions to their own problems. But designing a process can be time-consuming and finding the right activities can be difficult.
Check out our workshop planning guide to level-up your agenda design and start running more effective workshops. Need inspiration? Check out templates designed by expert facilitators to help you kickstart your process!
In this section, we’ll look at in-depth problem-solving methods that provide a complete end-to-end process for developing effective solutions. These will help guide your team from the discovery and definition of a problem through to delivering the right solution.
If you’re looking for an all-encompassing method or problem-solving model, these processes are a great place to start. They’ll ask your team to challenge preconceived ideas and adopt a mindset for solving problems more effectively.
- Six Thinking Hats
- Lightning Decision Jam
- Problem Definition Process
- Discovery & Action Dialogue
Design Sprint 2.0
- Open Space Technology
1. Six Thinking Hats
Individual approaches to solving a problem can be very different based on what team or role an individual holds. It can be easy for existing biases or perspectives to find their way into the mix, or for internal politics to direct a conversation.
Six Thinking Hats is a classic method for identifying the problems that need to be solved and enables your team to consider them from different angles, whether that is by focusing on facts and data, creative solutions, or by considering why a particular solution might not work.
Like all problem-solving frameworks, Six Thinking Hats is effective at helping teams remove roadblocks from a conversation or discussion and come to terms with all the aspects necessary to solve complex problems.
2. Lightning Decision Jam
Featured courtesy of Jonathan Courtney of AJ&Smart Berlin, Lightning Decision Jam is one of those strategies that should be in every facilitation toolbox. Exploring problems and finding solutions is often creative in nature, though as with any creative process, there is the potential to lose focus and get lost.
Unstructured discussions might get you there in the end, but it’s much more effective to use a method that creates a clear process and team focus.
In Lightning Decision Jam, participants are invited to begin by writing challenges, concerns, or mistakes on post-its without discussing them before then being invited by the moderator to present them to the group.
From there, the team vote on which problems to solve and are guided through steps that will allow them to reframe those problems, create solutions and then decide what to execute on.
By deciding the problems that need to be solved as a team before moving on, this group process is great for ensuring the whole team is aligned and can take ownership over the next stages.
Lightning Decision Jam (LDJ) #action #decision making #problem solving #issue analysis #innovation #design #remote-friendly The problem with anything that requires creative thinking is that it’s easy to get lost—lose focus and fall into the trap of having useless, open-ended, unstructured discussions. Here’s the most effective solution I’ve found: Replace all open, unstructured discussion with a clear process. What to use this exercise for: Anything which requires a group of people to make decisions, solve problems or discuss challenges. It’s always good to frame an LDJ session with a broad topic, here are some examples: The conversion flow of our checkout Our internal design process How we organise events Keeping up with our competition Improving sales flow
3. Problem Definition Process
While problems can be complex, the problem-solving methods you use to identify and solve those problems can often be simple in design.
By taking the time to truly identify and define a problem before asking the group to reframe the challenge as an opportunity, this method is a great way to enable change.
Begin by identifying a focus question and exploring the ways in which it manifests before splitting into five teams who will each consider the problem using a different method: escape, reversal, exaggeration, distortion or wishful. Teams develop a problem objective and create ideas in line with their method before then feeding them back to the group.
This method is great for enabling in-depth discussions while also creating space for finding creative solutions too!
Problem Definition #problem solving #idea generation #creativity #online #remote-friendly A problem solving technique to define a problem, challenge or opportunity and to generate ideas.
4. The 5 Whys
Sometimes, a group needs to go further with their strategies and analyze the root cause at the heart of organizational issues. An RCA or root cause analysis is the process of identifying what is at the heart of business problems or recurring challenges.
The 5 Whys is a simple and effective method of helping a group go find the root cause of any problem or challenge and conduct analysis that will deliver results.
By beginning with the creation of a problem statement and going through five stages to refine it, The 5 Whys provides everything you need to truly discover the cause of an issue.
The 5 Whys #hyperisland #innovation This simple and powerful method is useful for getting to the core of a problem or challenge. As the title suggests, the group defines a problems, then asks the question “why” five times, often using the resulting explanation as a starting point for creative problem solving.
5. World Cafe
World Cafe is a simple but powerful facilitation technique to help bigger groups to focus their energy and attention on solving complex problems.
World Cafe enables this approach by creating a relaxed atmosphere where participants are able to self-organize and explore topics relevant and important to them which are themed around a central problem-solving purpose. Create the right atmosphere by modeling your space after a cafe and after guiding the group through the method, let them take the lead!
Making problem-solving a part of your organization’s culture in the long term can be a difficult undertaking. More approachable formats like World Cafe can be especially effective in bringing people unfamiliar with workshops into the fold.
World Cafe #hyperisland #innovation #issue analysis World Café is a simple yet powerful method, originated by Juanita Brown, for enabling meaningful conversations driven completely by participants and the topics that are relevant and important to them. Facilitators create a cafe-style space and provide simple guidelines. Participants then self-organize and explore a set of relevant topics or questions for conversation.
6. Discovery & Action Dialogue (DAD)
One of the best approaches is to create a safe space for a group to share and discover practices and behaviors that can help them find their own solutions.
With DAD, you can help a group choose which problems they wish to solve and which approaches they will take to do so. It’s great at helping remove resistance to change and can help get buy-in at every level too!
This process of enabling frontline ownership is great in ensuring follow-through and is one of the methods you will want in your toolbox as a facilitator.
Discovery & Action Dialogue (DAD) #idea generation #liberating structures #action #issue analysis #remote-friendly DADs make it easy for a group or community to discover practices and behaviors that enable some individuals (without access to special resources and facing the same constraints) to find better solutions than their peers to common problems. These are called positive deviant (PD) behaviors and practices. DADs make it possible for people in the group, unit, or community to discover by themselves these PD practices. DADs also create favorable conditions for stimulating participants’ creativity in spaces where they can feel safe to invent new and more effective practices. Resistance to change evaporates as participants are unleashed to choose freely which practices they will adopt or try and which problems they will tackle. DADs make it possible to achieve frontline ownership of solutions.
7. Design Sprint 2.0
Want to see how a team can solve big problems and move forward with prototyping and testing solutions in a few days? The Design Sprint 2.0 template from Jake Knapp, author of Sprint, is a complete agenda for a with proven results.
Developing the right agenda can involve difficult but necessary planning. Ensuring all the correct steps are followed can also be stressful or time-consuming depending on your level of experience.
Use this complete 4-day workshop template if you are finding there is no obvious solution to your challenge and want to focus your team around a specific problem that might require a shortcut to launching a minimum viable product or waiting for the organization-wide implementation of a solution.
8. Open space technology
Open space technology- developed by Harrison Owen – creates a space where large groups are invited to take ownership of their problem solving and lead individual sessions. Open space technology is a great format when you have a great deal of expertise and insight in the room and want to allow for different takes and approaches on a particular theme or problem you need to be solved.
Start by bringing your participants together to align around a central theme and focus their efforts. Explain the ground rules to help guide the problem-solving process and then invite members to identify any issue connecting to the central theme that they are interested in and are prepared to take responsibility for.
Once participants have decided on their approach to the core theme, they write their issue on a piece of paper, announce it to the group, pick a session time and place, and post the paper on the wall. As the wall fills up with sessions, the group is then invited to join the sessions that interest them the most and which they can contribute to, then you’re ready to begin!
Everyone joins the problem-solving group they’ve signed up to, record the discussion and if appropriate, findings can then be shared with the rest of the group afterward.
Open Space Technology #action plan #idea generation #problem solving #issue analysis #large group #online #remote-friendly Open Space is a methodology for large groups to create their agenda discerning important topics for discussion, suitable for conferences, community gatherings and whole system facilitation
Techniques to identify and analyze problems
Using a problem-solving method to help a team identify and analyze a problem can be a quick and effective addition to any workshop or meeting.
While further actions are always necessary, you can generate momentum and alignment easily, and these activities are a great place to get started.
We’ve put together this list of techniques to help you and your team with problem identification, analysis, and discussion that sets the foundation for developing effective solutions.
Let’s take a look!
- The Creativity Dice
- Fishbone Analysis
- Problem Tree
- SWOT Analysis
- Agreement-Certainty Matrix
- The Journalistic Six
- LEGO Challenge
- What, So What, Now What?
- Journalists
Individual and group perspectives are incredibly important, but what happens if people are set in their minds and need a change of perspective in order to approach a problem more effectively?
Flip It is a method we love because it is both simple to understand and run, and allows groups to understand how their perspectives and biases are formed.
Participants in Flip It are first invited to consider concerns, issues, or problems from a perspective of fear and write them on a flip chart. Then, the group is asked to consider those same issues from a perspective of hope and flip their understanding.
No problem and solution is free from existing bias and by changing perspectives with Flip It, you can then develop a problem solving model quickly and effectively.
Flip It! #gamestorming #problem solving #action Often, a change in a problem or situation comes simply from a change in our perspectives. Flip It! is a quick game designed to show players that perspectives are made, not born.
10. The Creativity Dice
One of the most useful problem solving skills you can teach your team is of approaching challenges with creativity, flexibility, and openness. Games like The Creativity Dice allow teams to overcome the potential hurdle of too much linear thinking and approach the process with a sense of fun and speed.
In The Creativity Dice, participants are organized around a topic and roll a dice to determine what they will work on for a period of 3 minutes at a time. They might roll a 3 and work on investigating factual information on the chosen topic. They might roll a 1 and work on identifying the specific goals, standards, or criteria for the session.
Encouraging rapid work and iteration while asking participants to be flexible are great skills to cultivate. Having a stage for idea incubation in this game is also important. Moments of pause can help ensure the ideas that are put forward are the most suitable.
The Creativity Dice #creativity #problem solving #thiagi #issue analysis Too much linear thinking is hazardous to creative problem solving. To be creative, you should approach the problem (or the opportunity) from different points of view. You should leave a thought hanging in mid-air and move to another. This skipping around prevents premature closure and lets your brain incubate one line of thought while you consciously pursue another.
11. Fishbone Analysis
Organizational or team challenges are rarely simple, and it’s important to remember that one problem can be an indication of something that goes deeper and may require further consideration to be solved.
Fishbone Analysis helps groups to dig deeper and understand the origins of a problem. It’s a great example of a root cause analysis method that is simple for everyone on a team to get their head around.
Participants in this activity are asked to annotate a diagram of a fish, first adding the problem or issue to be worked on at the head of a fish before then brainstorming the root causes of the problem and adding them as bones on the fish.
Using abstractions such as a diagram of a fish can really help a team break out of their regular thinking and develop a creative approach.
Fishbone Analysis #problem solving ##root cause analysis #decision making #online facilitation A process to help identify and understand the origins of problems, issues or observations.
12. Problem Tree
Encouraging visual thinking can be an essential part of many strategies. By simply reframing and clarifying problems, a group can move towards developing a problem solving model that works for them.
In Problem Tree, groups are asked to first brainstorm a list of problems – these can be design problems, team problems or larger business problems – and then organize them into a hierarchy. The hierarchy could be from most important to least important or abstract to practical, though the key thing with problem solving games that involve this aspect is that your group has some way of managing and sorting all the issues that are raised.
Once you have a list of problems that need to be solved and have organized them accordingly, you’re then well-positioned for the next problem solving steps.
Problem tree #define intentions #create #design #issue analysis A problem tree is a tool to clarify the hierarchy of problems addressed by the team within a design project; it represents high level problems or related sublevel problems.
13. SWOT Analysis
Chances are you’ve heard of the SWOT Analysis before. This problem-solving method focuses on identifying strengths, weaknesses, opportunities, and threats is a tried and tested method for both individuals and teams.
Start by creating a desired end state or outcome and bare this in mind – any process solving model is made more effective by knowing what you are moving towards. Create a quadrant made up of the four categories of a SWOT analysis and ask participants to generate ideas based on each of those quadrants.
Once you have those ideas assembled in their quadrants, cluster them together based on their affinity with other ideas. These clusters are then used to facilitate group conversations and move things forward.
SWOT analysis #gamestorming #problem solving #action #meeting facilitation The SWOT Analysis is a long-standing technique of looking at what we have, with respect to the desired end state, as well as what we could improve on. It gives us an opportunity to gauge approaching opportunities and dangers, and assess the seriousness of the conditions that affect our future. When we understand those conditions, we can influence what comes next.
14. Agreement-Certainty Matrix
Not every problem-solving approach is right for every challenge, and deciding on the right method for the challenge at hand is a key part of being an effective team.
The Agreement Certainty matrix helps teams align on the nature of the challenges facing them. By sorting problems from simple to chaotic, your team can understand what methods are suitable for each problem and what they can do to ensure effective results.
If you are already using Liberating Structures techniques as part of your problem-solving strategy, the Agreement-Certainty Matrix can be an invaluable addition to your process. We’ve found it particularly if you are having issues with recurring problems in your organization and want to go deeper in understanding the root cause.
Agreement-Certainty Matrix #issue analysis #liberating structures #problem solving You can help individuals or groups avoid the frequent mistake of trying to solve a problem with methods that are not adapted to the nature of their challenge. The combination of two questions makes it possible to easily sort challenges into four categories: simple, complicated, complex , and chaotic . A problem is simple when it can be solved reliably with practices that are easy to duplicate. It is complicated when experts are required to devise a sophisticated solution that will yield the desired results predictably. A problem is complex when there are several valid ways to proceed but outcomes are not predictable in detail. Chaotic is when the context is too turbulent to identify a path forward. A loose analogy may be used to describe these differences: simple is like following a recipe, complicated like sending a rocket to the moon, complex like raising a child, and chaotic is like the game “Pin the Tail on the Donkey.” The Liberating Structures Matching Matrix in Chapter 5 can be used as the first step to clarify the nature of a challenge and avoid the mismatches between problems and solutions that are frequently at the root of chronic, recurring problems.
Organizing and charting a team’s progress can be important in ensuring its success. SQUID (Sequential Question and Insight Diagram) is a great model that allows a team to effectively switch between giving questions and answers and develop the skills they need to stay on track throughout the process.
Begin with two different colored sticky notes – one for questions and one for answers – and with your central topic (the head of the squid) on the board. Ask the group to first come up with a series of questions connected to their best guess of how to approach the topic. Ask the group to come up with answers to those questions, fix them to the board and connect them with a line. After some discussion, go back to question mode by responding to the generated answers or other points on the board.
It’s rewarding to see a diagram grow throughout the exercise, and a completed SQUID can provide a visual resource for future effort and as an example for other teams.
SQUID #gamestorming #project planning #issue analysis #problem solving When exploring an information space, it’s important for a group to know where they are at any given time. By using SQUID, a group charts out the territory as they go and can navigate accordingly. SQUID stands for Sequential Question and Insight Diagram.
16. Speed Boat
To continue with our nautical theme, Speed Boat is a short and sweet activity that can help a team quickly identify what employees, clients or service users might have a problem with and analyze what might be standing in the way of achieving a solution.
Methods that allow for a group to make observations, have insights and obtain those eureka moments quickly are invaluable when trying to solve complex problems.
In Speed Boat, the approach is to first consider what anchors and challenges might be holding an organization (or boat) back. Bonus points if you are able to identify any sharks in the water and develop ideas that can also deal with competitors!
Speed Boat #gamestorming #problem solving #action Speedboat is a short and sweet way to identify what your employees or clients don’t like about your product/service or what’s standing in the way of a desired goal.
17. The Journalistic Six
Some of the most effective ways of solving problems is by encouraging teams to be more inclusive and diverse in their thinking.
Based on the six key questions journalism students are taught to answer in articles and news stories, The Journalistic Six helps create teams to see the whole picture. By using who, what, when, where, why, and how to facilitate the conversation and encourage creative thinking, your team can make sure that the problem identification and problem analysis stages of the are covered exhaustively and thoughtfully. Reporter’s notebook and dictaphone optional.
The Journalistic Six – Who What When Where Why How #idea generation #issue analysis #problem solving #online #creative thinking #remote-friendly A questioning method for generating, explaining, investigating ideas.
18. LEGO Challenge
Now for an activity that is a little out of the (toy) box. LEGO Serious Play is a facilitation methodology that can be used to improve creative thinking and problem-solving skills.
The LEGO Challenge includes giving each member of the team an assignment that is hidden from the rest of the group while they create a structure without speaking.
What the LEGO challenge brings to the table is a fun working example of working with stakeholders who might not be on the same page to solve problems. Also, it’s LEGO! Who doesn’t love LEGO!
LEGO Challenge #hyperisland #team A team-building activity in which groups must work together to build a structure out of LEGO, but each individual has a secret “assignment” which makes the collaborative process more challenging. It emphasizes group communication, leadership dynamics, conflict, cooperation, patience and problem solving strategy.
19. What, So What, Now What?
If not carefully managed, the problem identification and problem analysis stages of the problem-solving process can actually create more problems and misunderstandings.
The What, So What, Now What? problem-solving activity is designed to help collect insights and move forward while also eliminating the possibility of disagreement when it comes to identifying, clarifying, and analyzing organizational or work problems.
Facilitation is all about bringing groups together so that might work on a shared goal and the best problem-solving strategies ensure that teams are aligned in purpose, if not initially in opinion or insight.
Throughout the three steps of this game, you give everyone on a team to reflect on a problem by asking what happened, why it is important, and what actions should then be taken.
This can be a great activity for bringing our individual perceptions about a problem or challenge and contextualizing it in a larger group setting. This is one of the most important problem-solving skills you can bring to your organization.
W³ – What, So What, Now What? #issue analysis #innovation #liberating structures You can help groups reflect on a shared experience in a way that builds understanding and spurs coordinated action while avoiding unproductive conflict. It is possible for every voice to be heard while simultaneously sifting for insights and shaping new direction. Progressing in stages makes this practical—from collecting facts about What Happened to making sense of these facts with So What and finally to what actions logically follow with Now What . The shared progression eliminates most of the misunderstandings that otherwise fuel disagreements about what to do. Voila!
20. Journalists
Problem analysis can be one of the most important and decisive stages of all problem-solving tools. Sometimes, a team can become bogged down in the details and are unable to move forward.
Journalists is an activity that can avoid a group from getting stuck in the problem identification or problem analysis stages of the process.
In Journalists, the group is invited to draft the front page of a fictional newspaper and figure out what stories deserve to be on the cover and what headlines those stories will have. By reframing how your problems and challenges are approached, you can help a team move productively through the process and be better prepared for the steps to follow.
Journalists #vision #big picture #issue analysis #remote-friendly This is an exercise to use when the group gets stuck in details and struggles to see the big picture. Also good for defining a vision.
Problem-solving techniques for developing solutions
The success of any problem-solving process can be measured by the solutions it produces. After you’ve defined the issue, explored existing ideas, and ideated, it’s time to narrow down to the correct solution.
Use these problem-solving techniques when you want to help your team find consensus, compare possible solutions, and move towards taking action on a particular problem.
- Improved Solutions
- Four-Step Sketch
- 15% Solutions
- How-Now-Wow matrix
- Impact Effort Matrix
21. Mindspin
Brainstorming is part of the bread and butter of the problem-solving process and all problem-solving strategies benefit from getting ideas out and challenging a team to generate solutions quickly.
With Mindspin, participants are encouraged not only to generate ideas but to do so under time constraints and by slamming down cards and passing them on. By doing multiple rounds, your team can begin with a free generation of possible solutions before moving on to developing those solutions and encouraging further ideation.
This is one of our favorite problem-solving activities and can be great for keeping the energy up throughout the workshop. Remember the importance of helping people become engaged in the process – energizing problem-solving techniques like Mindspin can help ensure your team stays engaged and happy, even when the problems they’re coming together to solve are complex.
MindSpin #teampedia #idea generation #problem solving #action A fast and loud method to enhance brainstorming within a team. Since this activity has more than round ideas that are repetitive can be ruled out leaving more creative and innovative answers to the challenge.
22. Improved Solutions
After a team has successfully identified a problem and come up with a few solutions, it can be tempting to call the work of the problem-solving process complete. That said, the first solution is not necessarily the best, and by including a further review and reflection activity into your problem-solving model, you can ensure your group reaches the best possible result.
One of a number of problem-solving games from Thiagi Group, Improved Solutions helps you go the extra mile and develop suggested solutions with close consideration and peer review. By supporting the discussion of several problems at once and by shifting team roles throughout, this problem-solving technique is a dynamic way of finding the best solution.
Improved Solutions #creativity #thiagi #problem solving #action #team You can improve any solution by objectively reviewing its strengths and weaknesses and making suitable adjustments. In this creativity framegame, you improve the solutions to several problems. To maintain objective detachment, you deal with a different problem during each of six rounds and assume different roles (problem owner, consultant, basher, booster, enhancer, and evaluator) during each round. At the conclusion of the activity, each player ends up with two solutions to her problem.
23. Four Step Sketch
Creative thinking and visual ideation does not need to be confined to the opening stages of your problem-solving strategies. Exercises that include sketching and prototyping on paper can be effective at the solution finding and development stage of the process, and can be great for keeping a team engaged.
By going from simple notes to a crazy 8s round that involves rapidly sketching 8 variations on their ideas before then producing a final solution sketch, the group is able to iterate quickly and visually. Problem-solving techniques like Four-Step Sketch are great if you have a group of different thinkers and want to change things up from a more textual or discussion-based approach.
Four-Step Sketch #design sprint #innovation #idea generation #remote-friendly The four-step sketch is an exercise that helps people to create well-formed concepts through a structured process that includes: Review key information Start design work on paper, Consider multiple variations , Create a detailed solution . This exercise is preceded by a set of other activities allowing the group to clarify the challenge they want to solve. See how the Four Step Sketch exercise fits into a Design Sprint
24. 15% Solutions
Some problems are simpler than others and with the right problem-solving activities, you can empower people to take immediate actions that can help create organizational change.
Part of the liberating structures toolkit, 15% solutions is a problem-solving technique that focuses on finding and implementing solutions quickly. A process of iterating and making small changes quickly can help generate momentum and an appetite for solving complex problems.
Problem-solving strategies can live and die on whether people are onboard. Getting some quick wins is a great way of getting people behind the process.
It can be extremely empowering for a team to realize that problem-solving techniques can be deployed quickly and easily and delineate between things they can positively impact and those things they cannot change.
15% Solutions #action #liberating structures #remote-friendly You can reveal the actions, however small, that everyone can do immediately. At a minimum, these will create momentum, and that may make a BIG difference. 15% Solutions show that there is no reason to wait around, feel powerless, or fearful. They help people pick it up a level. They get individuals and the group to focus on what is within their discretion instead of what they cannot change. With a very simple question, you can flip the conversation to what can be done and find solutions to big problems that are often distributed widely in places not known in advance. Shifting a few grains of sand may trigger a landslide and change the whole landscape.
25. How-Now-Wow Matrix
The problem-solving process is often creative, as complex problems usually require a change of thinking and creative response in order to find the best solutions. While it’s common for the first stages to encourage creative thinking, groups can often gravitate to familiar solutions when it comes to the end of the process.
When selecting solutions, you don’t want to lose your creative energy! The How-Now-Wow Matrix from Gamestorming is a great problem-solving activity that enables a group to stay creative and think out of the box when it comes to selecting the right solution for a given problem.
Problem-solving techniques that encourage creative thinking and the ideation and selection of new solutions can be the most effective in organisational change. Give the How-Now-Wow Matrix a go, and not just for how pleasant it is to say out loud.
How-Now-Wow Matrix #gamestorming #idea generation #remote-friendly When people want to develop new ideas, they most often think out of the box in the brainstorming or divergent phase. However, when it comes to convergence, people often end up picking ideas that are most familiar to them. This is called a ‘creative paradox’ or a ‘creadox’. The How-Now-Wow matrix is an idea selection tool that breaks the creadox by forcing people to weigh each idea on 2 parameters.
26. Impact and Effort Matrix
All problem-solving techniques hope to not only find solutions to a given problem or challenge but to find the best solution. When it comes to finding a solution, groups are invited to put on their decision-making hats and really think about how a proposed idea would work in practice.
The Impact and Effort Matrix is one of the problem-solving techniques that fall into this camp, empowering participants to first generate ideas and then categorize them into a 2×2 matrix based on impact and effort.
Activities that invite critical thinking while remaining simple are invaluable. Use the Impact and Effort Matrix to move from ideation and towards evaluating potential solutions before then committing to them.
Impact and Effort Matrix #gamestorming #decision making #action #remote-friendly In this decision-making exercise, possible actions are mapped based on two factors: effort required to implement and potential impact. Categorizing ideas along these lines is a useful technique in decision making, as it obliges contributors to balance and evaluate suggested actions before committing to them.
27. Dotmocracy
If you’ve followed each of the problem-solving steps with your group successfully, you should move towards the end of your process with heaps of possible solutions developed with a specific problem in mind. But how do you help a group go from ideation to putting a solution into action?
Dotmocracy – or Dot Voting -is a tried and tested method of helping a team in the problem-solving process make decisions and put actions in place with a degree of oversight and consensus.
One of the problem-solving techniques that should be in every facilitator’s toolbox, Dot Voting is fast and effective and can help identify the most popular and best solutions and help bring a group to a decision effectively.
Dotmocracy #action #decision making #group prioritization #hyperisland #remote-friendly Dotmocracy is a simple method for group prioritization or decision-making. It is not an activity on its own, but a method to use in processes where prioritization or decision-making is the aim. The method supports a group to quickly see which options are most popular or relevant. The options or ideas are written on post-its and stuck up on a wall for the whole group to see. Each person votes for the options they think are the strongest, and that information is used to inform a decision.
All facilitators know that warm-ups and icebreakers are useful for any workshop or group process. Problem-solving workshops are no different.
Use these problem-solving techniques to warm up a group and prepare them for the rest of the process. Activating your group by tapping into some of the top problem-solving skills can be one of the best ways to see great outcomes from your session.
- Check-in/Check-out
- Doodling Together
- Show and Tell
- Constellations
- Draw a Tree
28. Check-in / Check-out
Solid processes are planned from beginning to end, and the best facilitators know that setting the tone and establishing a safe, open environment can be integral to a successful problem-solving process.
Check-in / Check-out is a great way to begin and/or bookend a problem-solving workshop. Checking in to a session emphasizes that everyone will be seen, heard, and expected to contribute.
If you are running a series of meetings, setting a consistent pattern of checking in and checking out can really help your team get into a groove. We recommend this opening-closing activity for small to medium-sized groups though it can work with large groups if they’re disciplined!
Check-in / Check-out #team #opening #closing #hyperisland #remote-friendly Either checking-in or checking-out is a simple way for a team to open or close a process, symbolically and in a collaborative way. Checking-in/out invites each member in a group to be present, seen and heard, and to express a reflection or a feeling. Checking-in emphasizes presence, focus and group commitment; checking-out emphasizes reflection and symbolic closure.
29. Doodling Together
Thinking creatively and not being afraid to make suggestions are important problem-solving skills for any group or team, and warming up by encouraging these behaviors is a great way to start.
Doodling Together is one of our favorite creative ice breaker games – it’s quick, effective, and fun and can make all following problem-solving steps easier by encouraging a group to collaborate visually. By passing cards and adding additional items as they go, the workshop group gets into a groove of co-creation and idea development that is crucial to finding solutions to problems.
Doodling Together #collaboration #creativity #teamwork #fun #team #visual methods #energiser #icebreaker #remote-friendly Create wild, weird and often funny postcards together & establish a group’s creative confidence.
30. Show and Tell
You might remember some version of Show and Tell from being a kid in school and it’s a great problem-solving activity to kick off a session.
Asking participants to prepare a little something before a workshop by bringing an object for show and tell can help them warm up before the session has even begun! Games that include a physical object can also help encourage early engagement before moving onto more big-picture thinking.
By asking your participants to tell stories about why they chose to bring a particular item to the group, you can help teams see things from new perspectives and see both differences and similarities in the way they approach a topic. Great groundwork for approaching a problem-solving process as a team!
Show and Tell #gamestorming #action #opening #meeting facilitation Show and Tell taps into the power of metaphors to reveal players’ underlying assumptions and associations around a topic The aim of the game is to get a deeper understanding of stakeholders’ perspectives on anything—a new project, an organizational restructuring, a shift in the company’s vision or team dynamic.
31. Constellations
Who doesn’t love stars? Constellations is a great warm-up activity for any workshop as it gets people up off their feet, energized, and ready to engage in new ways with established topics. It’s also great for showing existing beliefs, biases, and patterns that can come into play as part of your session.
Using warm-up games that help build trust and connection while also allowing for non-verbal responses can be great for easing people into the problem-solving process and encouraging engagement from everyone in the group. Constellations is great in large spaces that allow for movement and is definitely a practical exercise to allow the group to see patterns that are otherwise invisible.
Constellations #trust #connection #opening #coaching #patterns #system Individuals express their response to a statement or idea by standing closer or further from a central object. Used with teams to reveal system, hidden patterns, perspectives.
32. Draw a Tree
Problem-solving games that help raise group awareness through a central, unifying metaphor can be effective ways to warm-up a group in any problem-solving model.
Draw a Tree is a simple warm-up activity you can use in any group and which can provide a quick jolt of energy. Start by asking your participants to draw a tree in just 45 seconds – they can choose whether it will be abstract or realistic.
Once the timer is up, ask the group how many people included the roots of the tree and use this as a means to discuss how we can ignore important parts of any system simply because they are not visible.
All problem-solving strategies are made more effective by thinking of problems critically and by exposing things that may not normally come to light. Warm-up games like Draw a Tree are great in that they quickly demonstrate some key problem-solving skills in an accessible and effective way.
Draw a Tree #thiagi #opening #perspectives #remote-friendly With this game you can raise awarness about being more mindful, and aware of the environment we live in.
Each step of the problem-solving workshop benefits from an intelligent deployment of activities, games, and techniques. Bringing your session to an effective close helps ensure that solutions are followed through on and that you also celebrate what has been achieved.
Here are some problem-solving activities you can use to effectively close a workshop or meeting and ensure the great work you’ve done can continue afterward.
- One Breath Feedback
- Who What When Matrix
- Response Cards
How do I conclude a problem-solving process?
All good things must come to an end. With the bulk of the work done, it can be tempting to conclude your workshop swiftly and without a moment to debrief and align. This can be problematic in that it doesn’t allow your team to fully process the results or reflect on the process.
At the end of an effective session, your team will have gone through a process that, while productive, can be exhausting. It’s important to give your group a moment to take a breath, ensure that they are clear on future actions, and provide short feedback before leaving the space.
The primary purpose of any problem-solving method is to generate solutions and then implement them. Be sure to take the opportunity to ensure everyone is aligned and ready to effectively implement the solutions you produced in the workshop.
Remember that every process can be improved and by giving a short moment to collect feedback in the session, you can further refine your problem-solving methods and see further success in the future too.
33. One Breath Feedback
Maintaining attention and focus during the closing stages of a problem-solving workshop can be tricky and so being concise when giving feedback can be important. It’s easy to incur “death by feedback” should some team members go on for too long sharing their perspectives in a quick feedback round.
One Breath Feedback is a great closing activity for workshops. You give everyone an opportunity to provide feedback on what they’ve done but only in the space of a single breath. This keeps feedback short and to the point and means that everyone is encouraged to provide the most important piece of feedback to them.
One breath feedback #closing #feedback #action This is a feedback round in just one breath that excels in maintaining attention: each participants is able to speak during just one breath … for most people that’s around 20 to 25 seconds … unless of course you’ve been a deep sea diver in which case you’ll be able to do it for longer.
34. Who What When Matrix
Matrices feature as part of many effective problem-solving strategies and with good reason. They are easily recognizable, simple to use, and generate results.
The Who What When Matrix is a great tool to use when closing your problem-solving session by attributing a who, what and when to the actions and solutions you have decided upon. The resulting matrix is a simple, easy-to-follow way of ensuring your team can move forward.
Great solutions can’t be enacted without action and ownership. Your problem-solving process should include a stage for allocating tasks to individuals or teams and creating a realistic timeframe for those solutions to be implemented or checked out. Use this method to keep the solution implementation process clear and simple for all involved.
Who/What/When Matrix #gamestorming #action #project planning With Who/What/When matrix, you can connect people with clear actions they have defined and have committed to.
35. Response cards
Group discussion can comprise the bulk of most problem-solving activities and by the end of the process, you might find that your team is talked out!
Providing a means for your team to give feedback with short written notes can ensure everyone is head and can contribute without the need to stand up and talk. Depending on the needs of the group, giving an alternative can help ensure everyone can contribute to your problem-solving model in the way that makes the most sense for them.
Response Cards is a great way to close a workshop if you are looking for a gentle warm-down and want to get some swift discussion around some of the feedback that is raised.
Response Cards #debriefing #closing #structured sharing #questions and answers #thiagi #action It can be hard to involve everyone during a closing of a session. Some might stay in the background or get unheard because of louder participants. However, with the use of Response Cards, everyone will be involved in providing feedback or clarify questions at the end of a session.
Save time and effort discovering the right solutions
A structured problem solving process is a surefire way of solving tough problems, discovering creative solutions and driving organizational change. But how can you design for successful outcomes?
With SessionLab, it’s easy to design engaging workshops that deliver results. Drag, drop and reorder blocks to build your agenda. When you make changes or update your agenda, your session timing adjusts automatically , saving you time on manual adjustments.
Collaborating with stakeholders or clients? Share your agenda with a single click and collaborate in real-time. No more sending documents back and forth over email.
Explore how to use SessionLab to design effective problem solving workshops or watch this five minute video to see the planner in action!
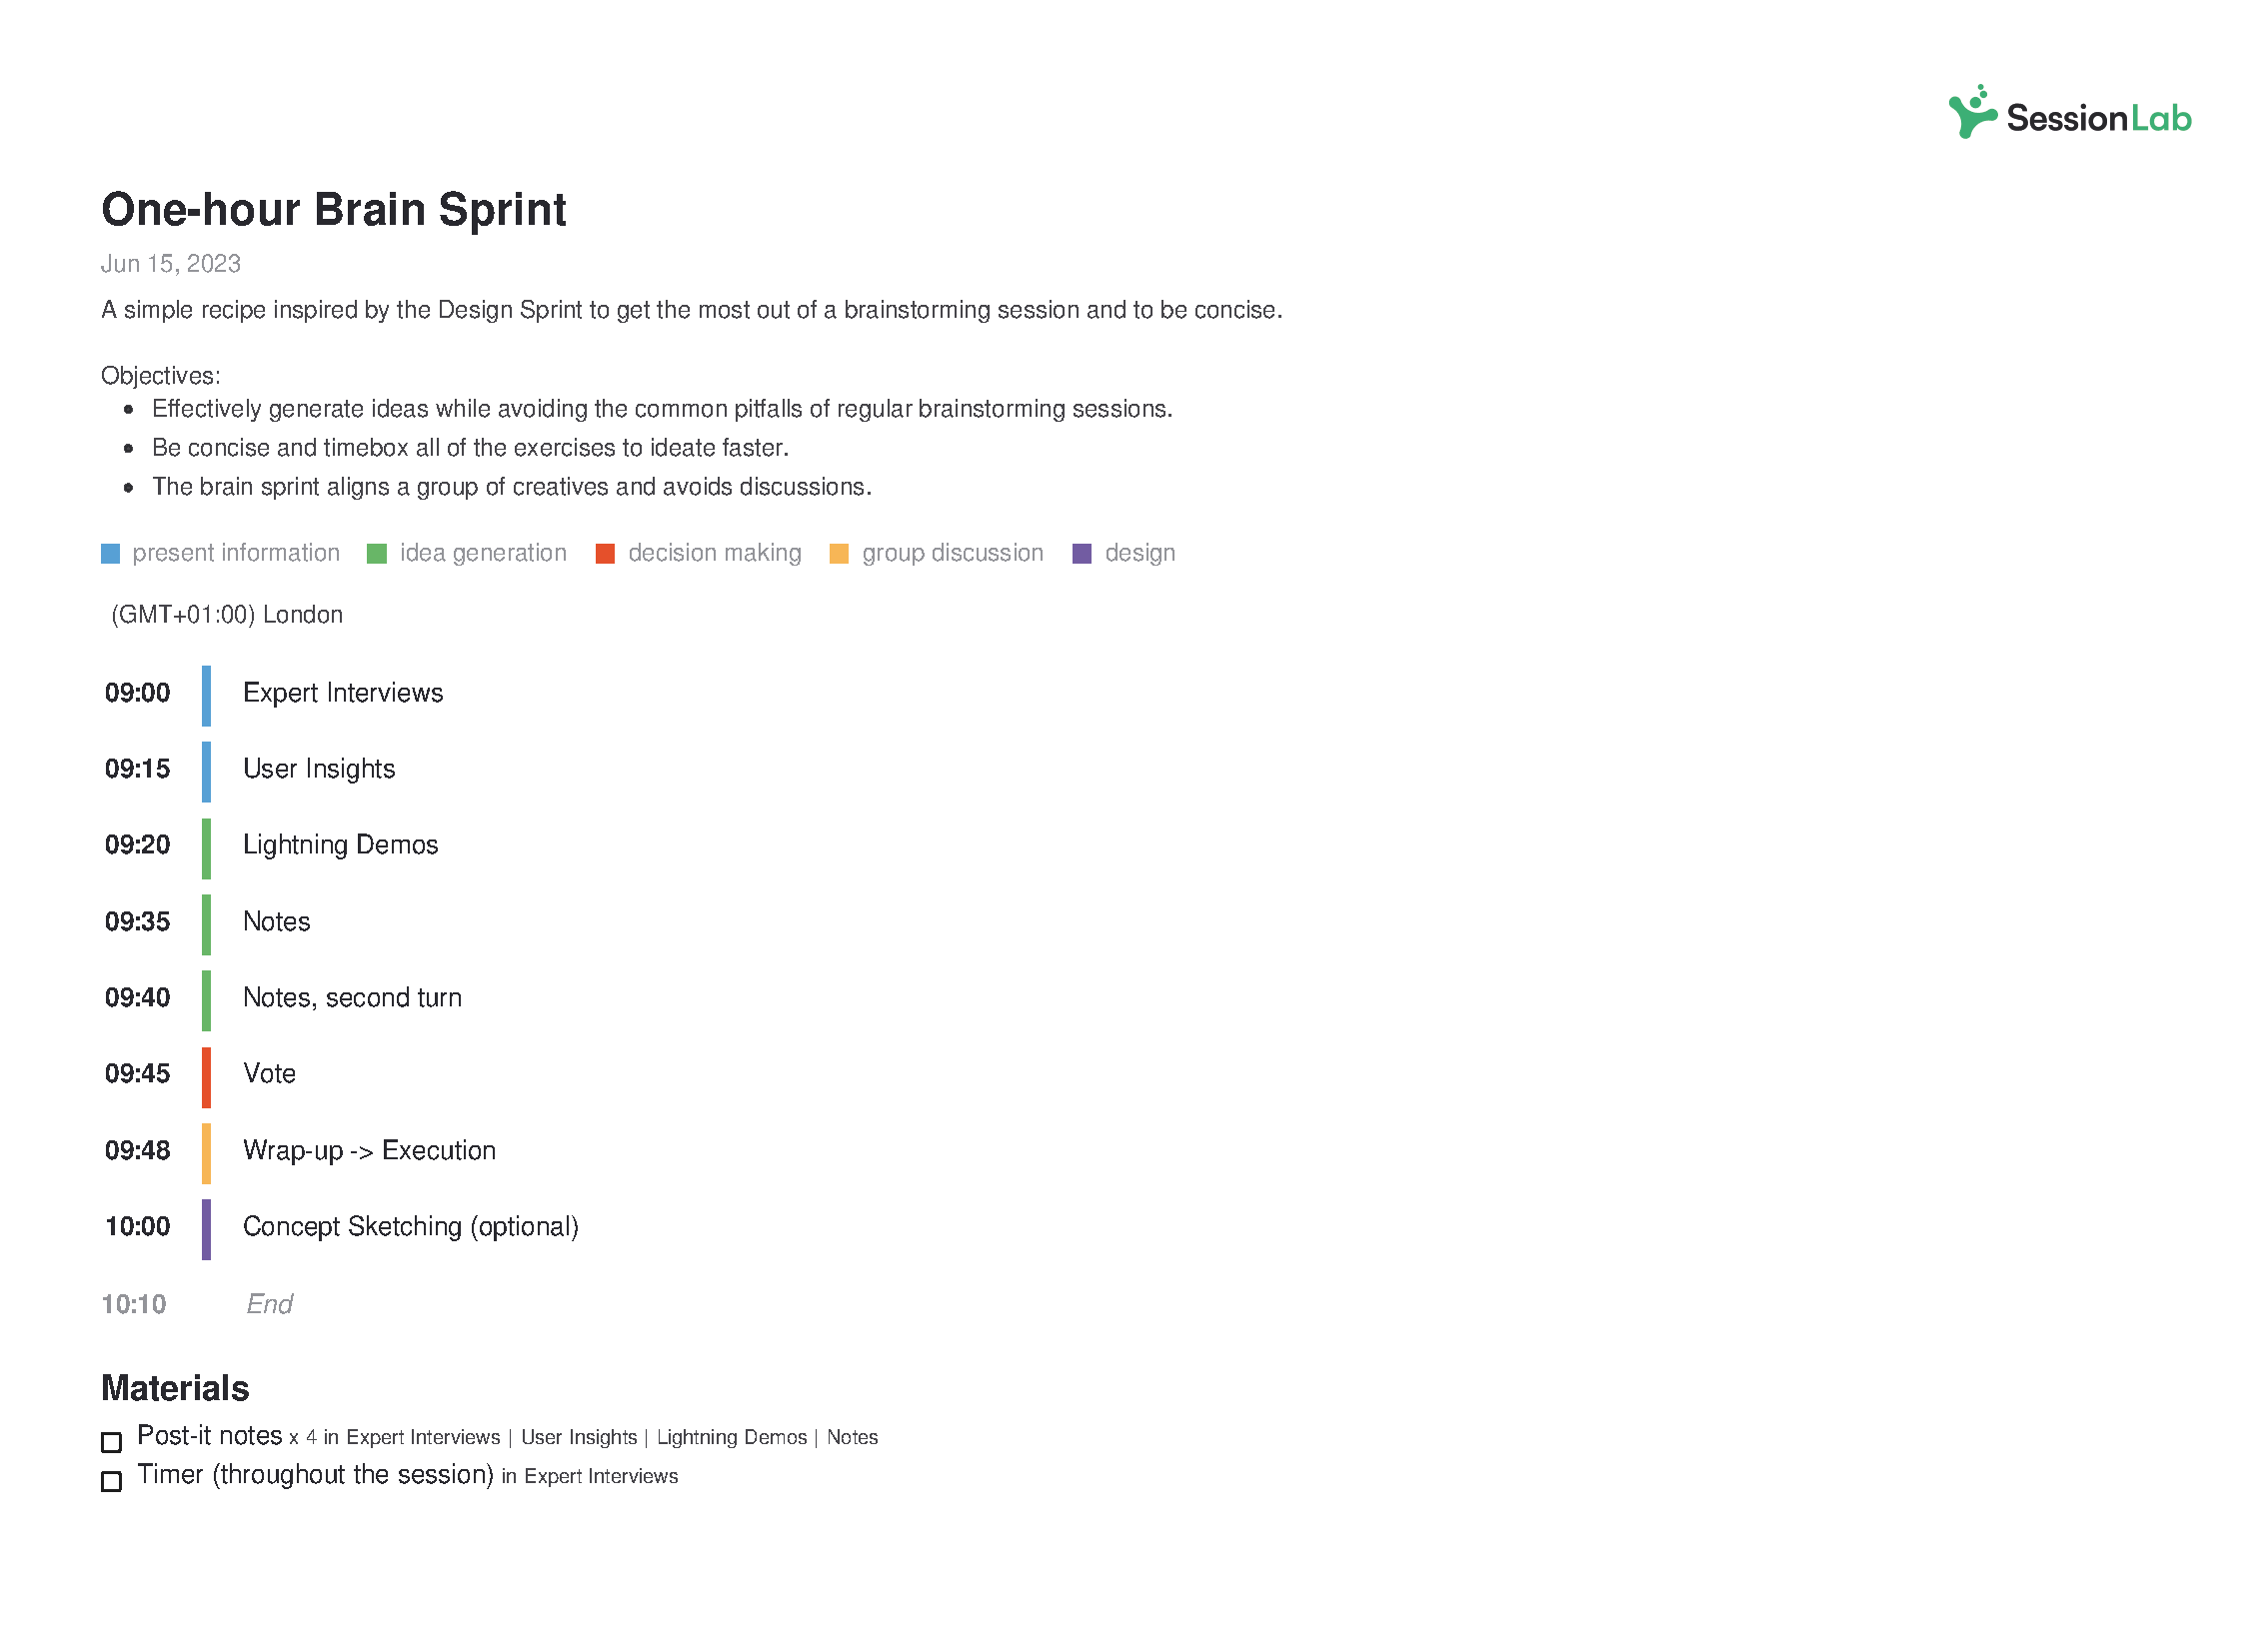
Over to you
The problem-solving process can often be as complicated and multifaceted as the problems they are set-up to solve. With the right problem-solving techniques and a mix of creative exercises designed to guide discussion and generate purposeful ideas, we hope we’ve given you the tools to find the best solutions as simply and easily as possible.
Is there a problem-solving technique that you are missing here? Do you have a favorite activity or method you use when facilitating? Let us know in the comments below, we’d love to hear from you!

thank you very much for these excellent techniques

Certainly wonderful article, very detailed. Shared!
Leave a Comment Cancel reply
Your email address will not be published. Required fields are marked *

Going from a mere idea to a workshop that delivers results for your clients can feel like a daunting task. In this piece, we will shine a light on all the work behind the scenes and help you learn how to plan a workshop from start to finish. On a good day, facilitation can feel like effortless magic, but that is mostly the result of backstage work, foresight, and a lot of careful planning. Read on to learn a step-by-step approach to breaking the process of planning a workshop into small, manageable chunks. The flow starts with the first meeting with a client to define the purposes of a workshop.…
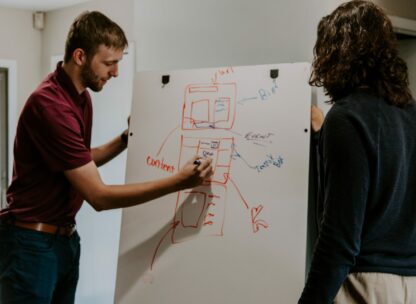
How does learning work? A clever 9-year-old once told me: “I know I am learning something new when I am surprised.” The science of adult learning tells us that, in order to learn new skills (which, unsurprisingly, is harder for adults to do than kids) grown-ups need to first get into a specific headspace. In a business, this approach is often employed in a training session where employees learn new skills or work on professional development. But how do you ensure your training is effective? In this guide, we'll explore how to create an effective training session plan and run engaging training sessions. As team leader, project manager, or consultant,…

Effective online tools are a necessity for smooth and engaging virtual workshops and meetings. But how do you choose the right ones? Do you sometimes feel that the good old pen and paper or MS Office toolkit and email leaves you struggling to stay on top of managing and delivering your workshop? Fortunately, there are plenty of online tools to make your life easier when you need to facilitate a meeting and lead workshops. In this post, we’ll share our favorite online tools you can use to make your job as a facilitator easier. In fact, there are plenty of free online workshop tools and meeting facilitation software you can…
Design your next workshop with SessionLab
Join the 150,000 facilitators using SessionLab
Sign up for free
Linguistics Olympiad
Test Your Mind
Problem-Solving Festival
Latest news.
Latest Problem-Solving News.

Ireland’s Top Young Problem-Solvers to Take on World’s Best Decoders at International Linguistics Olympiad

IOL 2018 Prague

Using Ozobots to hone primary school problem-solving skills

Register for All Ireland Linguistics Olympiad 2018!
Upcoming Problem-Solving Events.
What people say about Problem Solving

Prof. Vincent Wade
Organisation for Economic Co-operation and Development

Jane D’Altuin

Daniel Herlihy
Subscribe now and receive regular notifications of competitions, new puzzles, educational materials, and much more!
IMAGES
VIDEO
COMMENTS
Plan-Do-Check-Act (PDCA) and Define-Measure-Analyze-Improve-Control (DMAIC) are two acronyms indicating the steps an IE does to improve a process in a production system. PDCA. PDCA stands for Plan, Do, Check, and Act. The steps were developed by Shewhart and popularized by Deming; they are sometimes called the Shewhart Cycle.. Plan - Ask and answer the following questions.
However, they need to know when to use which tool in a manner that is appropriate for the situation. In this article, we discuss 7 tools including: The Ishikawa Fishbone Diagram (IFD) Pareto Chart. 5 Whys. Failure Mode and Effects Analysis (FMEA) Scatter Diagram. Affinity Diagram.
1 Problem definition. The first step in solving any problem is to define it clearly and accurately. You need to identify the scope, goals, constraints, and criteria of the problem, as well as the ...
The chapters give an overview of the profession and an introduction to some of the tools used by industrial engineers in industry. ... (i.e., Industrial Engineering, Teamwork, Problem Solving, Big Ideas in Industrial Engineering, Using Models, Deming's 14 Points, People in the System, Systems Thinking, Lean Operations, The IE Approach ...
Below we discuss five common root cause analysis tools, including: Pareto Chart. The 5 Whys. Fishbone Diagram. Scatter Diagram. Failure Mode and Effects Analysis (FMEA) Download our free Root Cause Analysis 101 Guidebook. Read 14 quality metrics every executive should know. 1.
Integrated steelmaking operations, from ironmaking to final steel categories/forms, are a complex industrial system. Decision-makers, in addition to the domain knowledge, need to understand many facets related to operations management, process execution, involved risk factors and material handling aspects, etc. The solution approach must address trade-offs, uncertainties, multiple stages ...
can be utilized as a method or process to reduce the manufacturing costs, production time and. increasing the production line productivity. Productivity can be def ined as a ratio between ou tput ...
If you are not sure how to fix the problem, it is okay to ask for help. Problem solving is a process and a skill that is learned with practice. It is important to remember that everyone makes mistakes and that no one knows everything. Life is about learning. It is okay to ask for help when you don't have the answer.
International I nstitute of I nformation Technology, Pune, Maharasht ra, India. Email: shethbhavik [email protected] m, [email protected], [email protected]. Abstract: Assembly ...
Quality Glossary Definition: Seven tools of quality "The Old Seven." "The First Seven." "The Basic Seven." Quality pros have many names for these seven basic tools of quality, first emphasized by Kaoru Ishikawa, a professor of engineering at Tokyo University and the father of "quality circles."Start your quality journey by mastering these tools, and you'll have a name for them too: indispensable.
Understand the basic knowledge and usage of the seven tools and use them for on-site kaizen activities. Utilize the opportunities to apply the knowledge of IE seven tools learned in the training into actual practice and workplace. Step 1: Training on 7 IE tools (3 days) ↓(1 month later). Step 2: 1st Follow-up "Process analysis" (1 day)
Techniques of industrial engineering are-. 1. Method study: To establish a standard method of performing a job or an operation after thorough analysis of the jobs and to establish the layout of production facilities to have a uniform flow of material without back tracking. 2. Time study ( work measurement ): This is a technique used to ...
NGT is used to generate and evaluate or rank a series of actions or solutions. It is often used after a brainstorming session to organize and evaluate the products of the brainstorming session. The problem or decision is stated by the facilitator. Ideas are generated or imported from a previous brainstorming session.
small scale industries needs methodology for selecting appropriate IE tool and techniques for solving common problems within industries. Karim and Arif-Uz-Zaman stated that current methods of selecting an appropriate ... Amit Kumar Arya and Suraj Choudhary[4] present a case study that solved the problem of high tool/Inventory
Flowcharts. Strategy maps. Mental maps. Idea maps. Concept maps. Layered process audit software. Charting software. MindManager. In this article, we've put together a roundup of versatile problem solving tools and software to help you and your team map out and repair workplace issues as efficiently as possible.
Option 1: Add more people to push the barrow. Option 2: Reduce number of rocks on load and increase number of rock deliveries. Root Cause: Incorrect wheel design. Limitations within the Design Process. Preventative Action: Redesign wheel to move barrow quicker and with a better material for sand application.
Solve Problems Effectively With Visual Thinking Tools. Visual problem solving templates to help analyze problems from different perspectives and find optimal solutions. Start For Free. Powerful visualization capabilities break complex challenges into simple components. Collaborate with your team to analyze root causes and find solutions.
Fishbone Diagram. The Fishbone Diagram, also known as the Cause-and-effect Diagram or the Ishikawa diagram, is a powerful problem-solving tool that visually maps out the potential causes of an issue. Its distinctive shape resembles the skeleton of a fish, where the "head" represents the problem and the "bones" branching out from the ...
The tools we recommend to help you define the problem and determine the cause (including the root cause) are: The 5W's (and the 5 WHY's) SWOT Analysis. Mind Mapping. Brainstorming. The Fishbone Diagram (or Cause and Effect Diagram) Affinity Mapping. To explore some of these further, see below under 'Tools of the Trade'.
6. Discovery & Action Dialogue (DAD) One of the best approaches is to create a safe space for a group to share and discover practices and behaviors that can help them find their own solutions. With DAD, you can help a group choose which problems they wish to solve and which approaches they will take to do so.
Gaelcholaiste Chiarrai, Kerry. "The problems themselves were engaging and challenging, and I hugely enjoyed myself. It's been a life-changing experience, and I've met people I hope to remain great friends with!" - speaking on AILO. Subscribe now and receive regular notifications of competitions, new puzzles, educational materials, and ...
Problem-solving tools refer to strategies that can help determine the cause of a problem and identify the best solutions available. The first step in addressing an issue at work is to outline your objectives. Once you establish the cause, you can isolate variables that can help contribute to a potential solution.
These skills are no longer just nice-to-haves — they are essential tools in a leader's repertoire, enabling quick adaptation and innovative problem-solving in the face of new challenges.