GE McKinsey Matrix (With Examples)
As per McKinsey, GE-McKinsey is a strategy-based tool that contains a nine-box matrix and provides a systematic way to the multi-business corporation for the purpose of prioritizing its investments among its subunits (business units).
In simple terms, GE-McKinsey Matrix is considered as a framework to evaluate the portfolio of businesses, gain insights into strategic implications, and set a priority of the investment required for each BU (business unit).
This matrix is also known as McKinsey Nine Box Matrix which is used by multi-business firms for the planning of their business portfolio. A group of businesses that jointly form a company is considered as a business portfolio. These independent businesses are generally termed as strategic business units (SBUs).
Today’s business world is more focusing on its decisions related to investments due to the increasing scarcity of resources. In this scenario of limited availability of resources, Businesses are required to make decisions based upon the best utilization of their cash and investments aiming at maximum ROI (Return on investment). The quarrel for investments can be viewed in every stage of a firm such as among teams, departments, business units, or divisions. In the case of diversified businesses, more complexity arises in this resource allocation quarrel as various brands, products, and portfolios are supposed to be managed. So, it becomes a headache for people or management to decide upon how much and where to invest cash for its proper utilization.
Companies that are into diversified businesses, manage complicated business portfolios, mostly, consist of a huge range of products and services. These diversified products or business units are different from each other in terms of their functioning, future prospects, and performance. So, it becomes very difficult for companies to decide upon into which products they should invest. Here the role GE-McKinsey Matrix comes as it supports businesses in this decision-making process in a more informed and systematic way. It is a strategic tool that solves the investment problem by making a comparison of business units and further assigning these units into the relevant groups that are either worth investing or should be divested or harvested.

ORIGIN OF GE-MCKINSEY MATRIX
The GE-McKinsey Matrix was developed in the 1970s when McKinsey & Company was hired by GE (General Electric) company to develop a tool or model for analysis and management of a business portfolio that is best suitable as per their requirements.
The business units are plotted on 9 cells of the above none-box GE-McKinsey Matrix that shows if the company is safe to invest in a product. Also, harvest or divest the product if it is unsafe to invest or whether further research is required on product investment i.e. either hold for time being or adopt a strategy of selective investment. The evaluation of business units is conducted on 2 axes i.e. competitive strength of the business unit and industry attractiveness.
The above nine-box matrix is considered as a systematic method for the decentralized and multi-business corporation to decide the best product or business for investing money.
Instead of depending upon the projections of each business unit’s future prospects, the corporate can evaluate whether a business unit will provide better returns in the near future by using the above two factors of the GE-McKinsey Matrix tool. By placing business units within the 9-box matrix, a logical and analytical map for their proper management is available. Business units that are placed above the diagonal in the above GE-McKinsey diagram may be pursued for further investments and growth by a business. Whereas business units along with the diagonal may be considered for selective investment strategy, and other business units that are placed below the diagonal should be a harvest or divest. It is essential to place business units into these 3 categories of the matrix at the starting of the analysis for further judgment.
AXIS OF GE-MCKINSEY MATRIX
The y-axis of the matrix represents market attractiveness and the x-axis shows a business unit’s competitive strength. Let’s have a look at both strategies below:
Industry attractiveness
It shows whether it will be tough or easy for a business to face competition in the market and gain profits. Industry becomes more attractive if it is more profitable. Different factors are included in industry attractiveness to determine the level of competition in it in a collective form. Following are the most common factors for industry attractiveness:
- The Growth rate in the long run
- Size of industry
- The Profitability of industry: This includes both entry and exit barriers, power of supplier and buyer, the threat of available complements and substitutes
- Structure of industry
- Changes in the Product life cycle
- Demand changes
- Price trend
- Macro environment factors
- Labor availability
- Market segmentation
- Seasonality
The Competitive strength of a BU (Business unit) or a product
Apart from industry attractiveness, the matrix also measures a business unit’s strength against its main competitors. Business strength is analyzed by business managers to determine if a sustainable competitive advantage is present in a business unit or not. In case of the presence of the same, the next issue arises is related to the period for which it will be sustained. The below factors decide a business unit’s competitive strength:
- Total share exists in the market
- Growth of market share as compared to competitors
- Strength of the brand or brand value
- Company’s profitability
- Customer loyalty
- VROP capabilities or resources
- Strength of a business unit to meet critical success factors of the industry
- Strength of a supply chain
- Product differentiation level
- Flexibility of production
INVESTMENT STRATEGIES FOR THE MATRIX
After placing SBUs in the matrix, companies can make investment strategies according to the position of SBU within the matrix. There are three alternates of investment strategies i.e.:
Selectivity
Though the potential of these business units is not clear, it doesn’t mean that the money won’t be invested in these. However, investments won’t be made in these BUs until the confirmation is there that investment in the SBUs under the Grow category is done.
Harvest or Divest
This category of investment strategy includes poor performing business units that are in less attractive markets and industries. If these business units contribute to revenue generation equivalent to the investment; then only investment will be made into these. In the absence of this, the possibility may arise to liquidate these.
GE-MCKINSEY MATRIX (DETAILED VERSION)
The detail of each option in the above matrix is as under:
- Protect position: This includes investment for protecting the position in the market and rapid growth.
- Build selectively: Consists of obtaining specialization in limited strengths in order to increase the ability to face competition. In case there is no possibility of competitive advantage or sustainable growth, then adopt the strategy of withdrawal from the market.
- Invest to build: Includes investment for the purpose of strengthening position in the market by developing strengths. Areas of vulnerability need to be managed.
- Manage for income: To invest in those areas of SBUs in which the earning or income potential is good and risks are comparatively low. Profits need to be maintained by upgrading the products that are most profitable.
- Harvest or Expand: If it is possible to expand with low investments then only look for it, else, operations to be streamlined to harvest the investment.
- Divest: This demands cost-cutting and no investment with immediate effect. For releasing the cash value for the company, the business unit should be sold.
- Protect position and refocus: To shift the currently available strengths of the business into a new market, it is required to view the possibilities of refocusing the business.
The process of GE-McKinsey Matrix
1. determine each business unit’s industry attractiveness.
This includes the following steps:
- List down factors: This is the first step in which a list of relevant factors needs to be identified and compiled while measuring the attractiveness of the industry. Some common factors are available across industries but an organization should choose the most appropriate factors for its business. These factors may include growth rate, size, environmental factors, competitive landscape, profit margin, etc. that affect the industry.
- Allocate weights: It is mandatory to give weights to the factors that have been listed. These weights indicate the value of the factor in determining industry attractiveness. This weight could be anything between 0.01 (not important) and 1.0 (extremely important) which has to assign to each factor. The aggregate of all the weights should be 1.0.
- Provide rating to the factors: Once the weight is allocated to the factors, the next step is to rate each one of them associated with each business unit or product of the company. Values can be selected between 1 to 5 or between 1 to 10. In this, 1 shows the low attractiveness of the industry, wherein, the scoring of 5 or 10 represents the high industry attractiveness.
- Determine the weighted and total/final scores: Once the weights and ratings are ready, a final or total score is calculated which is the aggregate of the weighted score of all factors for each business unit. Weighted scores are determined by multiplying ratings and weights.
By using the total score, companies can compare the industry attractiveness of each SBU.
2. Determine each business unit’s competitive strength
This includes the evaluation of the competitive strength of each business unit of the company. The process is the same as in the case of industry attractiveness except the evaluation is based on competitive strength this time. The process is mentioned below in brief:
- Factors list: Choosing and preparing a list of the available factors of competitive strength.
- Weight allocation: This represents the importance and role of each factor to achieve sustainable competitive advantage. Each factor should be assigned weight from 0.01 (not important) to 1.0 (most important). The total weight should come in equals to 1.0.
- Factor rating: The rating of each factor in each business unit should be between 1 to 5 or it can be between 1-10. Rating 1 symbolizes weak strength and rating 5 or 10 shows superior strength.
- Total score calculation: This is to obtain the total weighted score.
3. Positioning each business unit on Matrix
Now, after getting a score on industry attractiveness and competitive strength for each business unit, the next step is to position them on the matrix. A circle should represent each business unit that indicates the market size of each business unit as compared to other business units.
4. Information analysis
This includes analyzing the strategic possibilities for business units. The three investment strategies that an organization can adopt for each business unit are depending upon the position that each business unit occupies in the matrix. As discussed above, these strategies include grow or invest, income or selectivity, and harvest or divest. Each business unit is placed within these categories that determine what action to be executed in terms of investment. These investment strategies or investment implications are explained below in detail:
- Grow or invest areas in the matrix: It is suggested that companies should look for investments into those business units that fall into this category of matrix boxes as they offer a higher rate of return in the long-run. A lot of cash will be required by these as they will function in growing industries. Also, it will be essential for them to grow or maintain their market share. This investment is required for multi-purposes such as R&D activities, acquisitions, advertisements, etc. to meet future demand.
- Income or Selectivity areas: Companies should seek to invest in business units that fall under the income or selectivity box in the matrix only if they have enough remaining money after investing in grow or invest business units; and if there are possibilities to generate money from these business units in future. These BU’s are mostly considered at the end due to a great amount of uncertainty they carry.
- Harvest or Divest areas: There are business units that operate in unattractive markets or industries and there is no sustainable competitive advantage from them. Also, these business units are not even capable of achieving it and these perform comparatively in the poor form under harvest/ divest areas within the matrix. In this case, the question arises of what strategy to adopt for such BUs?
The solutions to the above question can be:
a) In case of excess cash generated by business units, companies should take them like business units that come under the area of cash cows in the BCG matrix. In other words, invest enough into these business units to keep them working and until they are generating cash incomes. So, it is profitable to make investments in such business units as long as an investment doesn’t go beyond the cash generated from them.
b) It is advisable to divest those business units that are running under losses. If it’s not possible to convert losses into profits then the company should go ahead with the liquidation of these business units.
5. Projection of the future potential or direction of business units
Through the above analysis of GE-McKinsey Matrix, a company can see the current scenario of each business unit’s industry attractiveness and competitive strength but it doesn’t predict their future scope of change. So, further analysis of each business unit’s potential is required as it may clarify that if investments are made in a few business units then it is possible to improve their competitive positions. Also, major growth in that industry may be experienced in the future later. This creates an impact on the decisions of investments that a company makes into its business units.
For instance, in the above evaluation, it shows that Business Unit 2 falls under the invest/grow category, but after undergoing further analysis, it reveals that this business unit has a tendency to shrink in the near future. So, in the upcoming future, the investment strategy of this business unit will be either harvest or divest instead of invest or grow. So, a company won’t invest the same amount in business unit 2 as it was investing in it during the initial phase. To represent the future direction of each business unit, an arrow may be used.
Below is the expectation w.r.t each business unit according to future analysis:
SBU1: The company expects that the industry attractiveness and competitive strength of this business unit will improve in the near future.
SBU2: The company expects that competitive position will decline with time and industry will become less attractive.
SBU3 : It’s expected that industry attractiveness will remain the same as it is now, but the competitive strength of this business unit is expected to improve.
FUTURE DIRECTION OF BUs IN MATRIX
6. Prioritize investments
This is the last step in the process that includes making decisions about where and how the investment of the cash to be made. Few queries that may require solutions along with matrix analysis are:
- Is it really fruitful to invest in some business units?
- How much to invest in different units?
- Which sectors like R&D, customer service, marketing, value chain, etc. require more investment within a business unit for improving its performance?
EXAMPLES OF GE-MCKINSEY MATRIX (PRACTICAL IMPLICATIONS IN RENOWNED BRANDS)
1. apple inc..
Let’s see the practical implication of GE-McKinsey Matrix with an example of a large technology brand Apple Inc. The company hastha multi-businesses or multi-business units that are operating in different markets such as laptops, desktops, Tablets (iPads), smartphones (iPhones), portable music players (iPods), etc. Apple also develops software to facilitate these products.
A competitor of Apple who is looking to gain competitive access to Apple’s activities could do this by plotting its business units in the matrix. Through this analysis, the competitor could find out different business units into which apple is about to invest a huge amount, divest, or develop selectively. The x-axis i.e. industry attractiveness would be comparatively easy to access for the competitor in case of operating in the same market, as this includes Apple’s external factors. This consists of information that could be easily revealed like the growth rate of the market, the current size of the market, etc. Still, few factors would have to be examined thoroughly, like entry barriers and technological development.
On the other hand, the competitive strength of the business unit i.e. y-axis would be quite tough to be assessed as it includes internal factors of Apple i.e. access to resources, the strength of management, customer loyalty. In this, secondary sources like media, internet, etc. could be a great help to obtain a great amount of information.
2. Invest or Grow strategy of Ford electric car
Ford was not investing in the electric car couple of years back even being the most famous automakers around the world. Two major reasons were there of doing so i.e.:
- Ford has a strong presence or core competency in the sector of a classic automobile, but in the electric automobile, it is not there. To design and manufacture an electric automobile like an electric car is quite different from the traditional automobile in terms of powertrain, engine, etc. The components are totally different from an electric car in which Ford had no strong expertise.
- Another reason was the market as the demand for electric cars was rising but people preferred traditional cars. Thus, it was not actually a booming market of electric cars that time as the industry was not that attractive for the electric car segment.
To find a solution, Ford did research and once they made their base strong in the segment of electric cars and also, the industry became much attractive; then Ford made an investment in it.
3. Divest or Harvest strategy by Microsoft in Zune mp3 player
In 2006, Microsoft has introduced its mp3 player i.e. Zune. A year later, once Apple launched iPhone then Mp3 players started escaping from the market. The smartphone market which was emerging and new industry resulted in making mp3 players totally unimportant. People started using their phones.
To get rid of this, Microsoft discontinued its mp3 player brand Zune in 2008. It was the right decision for the company as they hadn’t any strong presence in the market or industry of mp3 players and it couldn’t get success in this. Also, the mp3-player industry had lost its attractiveness after the launch of the smartphone by Apple
MERITS OF GE-MCKINSEY MATRIX
1. Businesses that have business units more than a hundred can raise complexity. Also, businesses are lack of infinite resources for investment. The GE-McKinsey Matrix facilitates businesses to make an analysis of the portfolio of their business units to discover:
- Business units that should get less or more investment.
- New products that should be added to the portfolio of business.
- Products or business units that need to be divested.
2. It helps in raising awareness for the performance of business units or products in the respective industry or market. Also, it assists in strategy development to gain maximum returns from available resources.
3. Facilitates in extracting information related to the strengths and weaknesses of a business unit and to use strategies for improving the performance of business units.
4. Helps businesses in their growth and acts as an information resource for market opportunities in the future.
LIMITATIONS OF GE-MCKINSEY MATRIX
Different challenges or limitations are also there with the matrix such as:
- It is very difficult to determine the attractiveness of the market especially in a market that is operating in an ever-changing environment.
- Also, discovering the business unit’s strength and assigning weight to it against industry attractiveness is also quite tough. So, in the case of a mismatch of variables, a company might invest in the growth of a business, which is otherwise required to be held back and it ultimately leads to unnecessary wastage of resources.
Related Posts
6 Real Life Examples Of Game Theory
15 Examples of Traditional Marketing
Advertising Exposure Model
PESTEL Analysis: Definition, Examples, Importance & Advantages
Management consulting
Horizontal Integration Strategy (with examples)
Add comment cancel reply.
B2U – Business-to-you.com
THE place that brings real life business, management and strategy to you
GE McKinsey Matrix: A Multifactorial Portfolio Analysis in Corporate Strategy
The GE-McKinsey Matrix (a.k.a. GE Matrix, General Electric Matrix, Nine-box matrix) is just like the BCG Matrix a portfolio analysis tool used in corporate strategy to analyse strategic business units or product lines based on two variables: industry attractiveness and the competitive strength of a business unit. By combining these two variables into a matrix, a corporation can plot their business units accordingly and determine where to invest, where to hold their position, and where to harvest or divest. However, different from the BCG Matrix, the GE-McKinsey Matrix uses multiple factors that are combined to determine the measure of the two variables industry attractiveness and competitive strength. This is an important distinction, since the BCG Matrix has been criticized a lot on its use of only one single (and perhaps outdated) variable for each axis.
The name of the framework stems from the year 1970 in which General Electric (GE) hired the strategy consulting firm McKinsey&Company to consult GE in managing their large and complex portfolio of strategic business units. Therefore, it is McKinsey (not GE) that created the framework as a means to help GE cope with its strategic decisions on a corporate level.
Figure 1: GE McKinsey Nine Box Matrix
Industry Attractiveness
On the vertical axis of the GE Mckinsey Matrix, we find the variable Industry Attractiveness which can be divided into High, Medium and Low. Industry attractiveness is demonstrated by how beneficial it is for a company to enter and compete within a certain industry based on the profit potential of that specific industry. The higher the profit potential of an industry is, the more attractive it becomes. An industry’s profitability in turn is affected by the current level of competition and potential future changes in the competitive landscape. When evaluating industry attractiveness, you should look at how an industry will change in the long run rather than in the near future, because the investments needed for a business usually require long lasting commitment. Industry attractiveness consists of many factors that collectively determine the level of competition and thus its profit potential. The most common factors to look at are:
- Industry size
- Long-run growth rate
- Industry structure (use Porter’s Five Forces or Structure-Conduct-Performance model)
- Industry life cycle (use Product Life Cycle )
- Macro environment (use PESTEL Analysis )
- Market segmentation
Competitive Strength
On the horizontal axis we find the Competitive Strength of a business unit which can also be divided into High, Medium and Low. This variable measures how strong or competent a particular company is against its rivals: it is an indicator of its ability to compete within a certain industry. A company’s strengths are its characteristics that give it an advantage over others (competitions/rivals). These strengths are often referred to as unique selling points (USP’s), firm-specific advantages (FSA’s) or more widely known as sustainable competitive advantages. Apart from a company’s competitive position right now, it is also very important to look at how sustainable its position is in the long run. So where Industry Attractiveness is about the level of competition in the entire industry, Competitive Strength is about the (future) ability to compete of one single company within that specific industry. Competitive strength also consists of multiple factors that together make up a company’s total score. The most common factors to look at are:
- Profitability
- Market share
- Business growth
- Brand equity
- Level of differentiation (use the Value Disciplines or Porter’s Generic Strategies )
- Firm resources (use the VRIO Framework )
- Efficiency and effectiveness of internal linkages (use the Value Chain Analysis )
- Customer loyalty (use the Net Promoter Score )
Figure 2: GE McKInsey Matrix Strategies
Strategic implications
Based on the 3 degrees (High, Medium and Low) of both Industry Attractiveness and Competitive Strength, the matrix can be crafted consisting of 9 different boxes with 9 different scenarios and corresponding strategic actions. The strategic actions to choose from are: Invest/Grow strategy, Selectivity/Earnings strategy (sometimes referred to as Hold strategy), and the Harvest/Divest strategy.
Invest/Grow strategy
The best section for a company or business unit to be in is the Invest/Grow section. A company can reach this scenario if it is operating in a moderate to highly attractive industry while having a moderate to highly competitive position within that industry. In such a situation there is a massive potential for growth. However, in order to be able to grow, a company needs resources such as assets and capital. These investments are necessary to increase capacity, to reach new customers through more advertisements or to improve products through Research & Development. Companies can also choose to grow externally via Mergers & Acquisitions apart from growing organically. Again, a company will need investments in order to realize such an endavour. The most notable challenge for companies in these sections are resource constraints that block them from growing bigger and becoming/maintaining market leadership.
Selectivity/Earnings strategy
Companies or business units in the Selectivity/Earnings sections are a bit more tricky. They are either companies with a low to moderate competitive position in an attractive industry or companies with an extremely high competition position in a less attractive industry. Deciding on whether to invest or not to invest largely depends on the outlook that is expected of either the improvement in competitive position or the potential to shift to more interesting industries. These decisions have to be made very carefully, since you want to use most of the investments available to the companies in the Invest/Grow section. The “left-over” investments should be used for the companies in the Selectivity/Earnings section with the highest potential for improvements, while being monitored closely to measure its progress on the way.
Harvest/Divest strategy
Finally we are left with companies or business units that either have a low competitive position, are active in an unattractive industry or a combination of the two. These companies have no promising outlooks anymore and should not be invested in. Corporate strategists have two main options to consider: 1. They divest the business units by selling it to an interested buyer for a reasonable price. This also known as a carve-out. Selling the business unit to another player in the industry that has a better competitive position is not a strange idea at all. The buyer might have better competences to make it a success or they can create value by combining activities (synergies). The cash that results from selling the business unit can consequently be used in Invest/Grow business units elsewhere in the portfolio. 2. Or corporate strategists can choose a harvest strategy. This basically means that the business unit gets just enough investments (or non at all) to keep the business running, while reaping the few fruits that may be left. This is a very short-term perspective action that allows corporate strategists to subtract as much remaining cash as possible, but is likely to result in the liquidation of the business unit eventually.
GE McKinsey Matrix In Sum
The GE McKinsey Matrix is a good alternative for the BCG Matrix and has the advantage that the two variables used consist of multiple factors combined. It may be quite a task however to quantify factors such as brand equity and industry structure,F and combine them all into a single number that can be plotted on the nine-box matrix. For corporate strategist in portfolio management, the model functions as a great starting point to base investment decisions on.
Further Reading:
- McKinsey & Company (2008). Enduring Ideas: The GE–McKinsey Nine-box Matrix. McKinsey Quarterly.
Share this:
- Click to share on Facebook (Opens in new window)
- Click to share on LinkedIn (Opens in new window)
- Click to share on WhatsApp (Opens in new window)
- Click to share on Reddit (Opens in new window)
- Click to share on Pinterest (Opens in new window)
- Click to share on Telegram (Opens in new window)
- Click to share on X (Opens in new window)
- ← Product Life Cycle: The Introduction, Growth, Maturity and Decline of a Product Category
- Porter’s Generic Strategies: Differentiation, Cost Leadership and Focus →
Leave a Reply Cancel reply
Your email address will not be published. Required fields are marked *
Enduring Ideas: The GE–McKinsey nine-box matrix
With the rise of multibusiness enterprises in the 20th century, companies began to struggle with managing a number of business units profitably. In response, management thinkers developed frameworks to address this new complexity. One that arose in the early 1970s was the GE–McKinsey nine-box framework, following on the heels of the Boston Consulting Group’s well-known growth share matrix.
The nine-box matrix offers a systematic approach for the decentralized corporation to determine where best to invest its cash. Rather than rely on each business unit's projections of its future prospects, the company can judge a unit by two factors that will determine whether it's going to do well in the future: the attractiveness of the relevant industry and the unit’s competitive strength within that industry.
Placement of business units within the matrix provides an analytic map for managing them. With units above the diagonal, a company may pursue strategies of investment and growth; those along the diagonal may be candidates for selective investment; those below the diagonal might be best sold, liquidated, or run purely for cash. Sorting units into these three categories is an essential starting point for the analysis, but judgment is required to weigh the trade-offs involved. For example, a strong unit in a weak industry is in a very different situation than a weak unit in a highly attractive industry.
The nine-box matrix is the forerunner of a number of portfolio models, including MACS 1 1. Market-activated corporate strategy; see Frederick W. Gluck, Stephen P. Kaufman, A. Steven Walleck, Ken McLeod, and John Stuckey, “ Thinking strategically ,” June 2000. and the portfolio of initiatives. 2 2. See Lowell L. Bryan, “ Just-in-time strategy for a turbulent world ,” McKinsey Quarterly , 2002 Special edition: Risk and resilience. The criteria for assessing industry attractiveness and competitive strength have grown more sophisticated over the years. To this day, most large companies with a formal approach to modeling their businesses refer to the nine-box matrix or some descendant of it.
In one of a series of interactive presentations, McKinsey alumnus Kevin Coyne describes the GE–McKinsey nine-box matrix, a framework that offers a systematic approach for the multibusiness corporation to prioritize its investments among its business units.
Related Articles

Enduring Ideas: Classic McKinsey frameworks that continue to inform management thinking

Thinking strategically

Just-in-time strategy for a turbulent world
McKinsey GE Matrix: Importance & How To Use It (2024)

Making the right decision at the right time is hard. It’s a struggle business leaders know well.
A broken decision-making process, the wrong strategic tools, and no visibility into the company’s portfolio performance can lead to failed strategies and large organizations going out of business.
But the ability to recognize growth opportunities and cut dead-end strategies in time has always been a competitive advantage. And GE Matrix is one of the strategic tools that can help you in the process.
In this article, we will cover everything you need to know about this framework, including HOW to use it, and WHEN you should use it.
⚠️ Go beyond the matrix! While it helps prioritize investments, the GE Matrix shouldn't be the final stop. Cascade Strategy Execution Platform bridges the gap between portfolio analysis and action. Talk to a strategy expert and translate your GE Matrix insights into a strategic plan with clear ownership and measurable results.
- McKinsey’s GE Matrix is a visual tool designed to help portfolio managers determine resource allocation for multi-business portfolios.
- The GE Matrix looks at two factors when scoring SBUs (Strategic Business Units) — the strength of a particular business and the attractiveness of the industry.
- Pros: Along with providing an overview of SBU performance, the GE Matrix also prescribes three strategic paths (grow, hold, and harvest) to inform strategic decisions.
- Cons: The GE Matrix only offers a snapshot of business potential, which must be contextualized by strategic decision-makers.

What Is the GE Matrix?
The GE Matrix is a strategic framework that helps multi-business corporations manage portfolios and prioritize investments across products and SBUs (Strategic Business Units).

The GE Matrix looks at two factors: the competitive strength of an SBU and the attractiveness of the market in which it operates.
Based on where the SBU sits within the 3x3 GE Matrix, portfolio managers can quickly answer three strategic questions:
- How to allocate capital throughout the organization’s portfolio of companies?
- What products or additional SBUs are needed in their portfolio?
- Which SBUs should be divested?
The Components Of The GE-McKinsey Nine-Box Matrix
Let’s look at the components of the GE-McKinsey Matrix to make sense of the results.
The vertical axis scores the industry attractiveness (either low, medium, or high) of SBUs. A higher score on this axis will place an SBU higher in the GE Matrix.

The horizontal axis indicates the SBU's strength as either low, medium, or high. It moves from right to left, but it goes from high to low.

Invest/Grow (Green)
SBUs in these blocks have a mixture of solid business performance and an attractive industry. They are primed for growth and should be allocated resources and capital.

Selectivity/Earnings (Orange)
SBUs that fall within these blocks aren’t performing optimally or operate in an unattractive industry. These business units require a more conservative approach to either growth or divestment strategies.

Harvest/Divest (Red)
If an SBU is mapped in the red blocks, this indicates that a divestment/harvest strategy should be taken. Generally, this means that a business should be closed, further investment should be withheld, or the company should be run for cash.

How To Use GE Matrix?
1. determine the industry attractiveness of each sbu.
Calculate the market attractiveness in which each SBU operates. Remember, this is a subjective estimate based on your understanding of the SBUs industry or sector.
Score the SBUs industry by looking at factors like:
- Market size
- Industry profitability
- Market growth potential
- Industry segmentation
- Market profitability
- Differentiation
- Market growth rate
- Level of competition
Important note: The scale you use to score SBU strength and industry attractiveness will depend on your needs. Most businesses use a 1-10 scorecard, but you may want to use a different range when assigning values.
2. Determine the competitive strength of each SBU
You’ll then repeat this process for each company in your portfolio. Look at the strength of the business unit and its competitive position in the market.
Factors you can consider when working out the strength of a business unit:
- Sustainable competitive advantages (use VRIO analysis )
- Brand equity
- Customer loyalty
- Market share
- Internal competencies
- Strength of the value chain (use value chain analysis )
- Production capacity
- Product lines
- Pricing and cash flows
- Profit margin compared to competitors
Important note: Different factors have different levels of importance. When calculating industry attractiveness and business strength scores, you’ll need to weigh numerous factors to reflect this.
3. Plot the information on the GE Matrix
Next, plot the values for each strategic business unit on your Matrix. Use the market attractiveness score to plot your Y-axis position and the business strength score to plot your X-axis position.
The location of each SBU on the 3x3 chart will indicate whether the company should grow, hold, or harvest specific business units.
4. Identify the future direction of each SBU
The GE Matrix only provides a view of the current state of SBUs in a portfolio and doesn’t account for other variables that may impact a business's viability.
This means that teams that use the GE Matrix must analyze business units in more detail to understand all strategic implications.
Using different strategic analysis tools, such as SWOT analysis , Porter’s 5 Forces , or PESTEL analysis, could help you analyze internal and external environmental factors. This will also help you to identify potential risks in the future.
5. Choose where to invest and focus your attention
Once you have a picture of your portfolio mapped out on the GE Matrix, you’ll still need to answer some critical questions before making decisions about SBUs.
For example, how much money should you put into a specific business unit? Does investing in these SBUs align with your long-term strategy? Which parts of a particular SBU should you invest in?
As Michael Porter, the father of the modern business strategy, says, “ The essence of strategy is choosing what not to do ”.
At this point, you should clearly understand what your organization will focus on. This will help your organization to stay on the right track and prevent wasting resources on misaligned efforts.
6. Turn insights into results
With a clear idea of direction and new priorities, you should take those insights and turn them into an actionable strategic plan.
A strategy execution platform like Cascade can streamline the process of communicating new goals, strategizing, and executing strategic initiatives. It can also help your organization ensure performance and align your portfolio strategy with the company’s high-level strategy.
3 Examples Of GE Matrix And Its Possible Strategic Scenarios
Ge matrix example (harvest strategy): microsoft internet explorer.
At one point, Microsoft Internet Explorer, was the dominant internet browser in the market. In 2003, more than 95% of all internet users were using it to surf the web. Here’s how the GE Matrix might look for the Internet Explorer SBU over time.
The 2003 Microsoft Internet Explorer was:1) A strong business unit 2) In an attractive industry
It would have been somewhere in the top left corner of a GE-McKinsey Matrix.

However, more web browsers started to appear, and the industry became more competitive. By 2010, Microsoft had lost 35% of its web browser market share to other competitors such as Firefox, Chrome, and Safari.
After 2010, the Internet Explorer SBU likely scored lower in competitive strength and market attractiveness compared to its earlier days.

Based on these significant changes, Microsoft likely decided that the Internet Explorer business unit would need to be closed, run for cash, or selectively harvested.
And that’s the strategy the company followed over the next 12 years.
- In 2013 , Microsoft released the last version of Internet Explorer (IE 11).
- In 2015 , they launched a new web browser, Microsoft Edge.
- In 2022 , they ended support and retired the program.
GE Matrix Example (Hold Strategy): David Jones
In 2014, Woolworths Holding Ltd., a prominent South African retail chain, acquired Australian retailer David Jones, believing it could generate A$130 million per annum in earnings within five years.
According to Woolworths Holding Ltd., David Jones had:
- A strong SBU with a 176-year history in Australia
- An attractive industry with a strong position in the retail market.
Here’s an example of how David Jones’ GE Matrix might have looked between 2014 and 2021:

However, the David Jones brand underperformed, and original plans to expand operations stagnated. Here’s how its position might have looked in 2015.

Woolworths Holding Ltd. likely decided to take a selective harvest/grow approach in response to the changing Australian retail market. This strategy is evident in some of their significant decisions between 2015 and 2022.
- In 2015, David Jones implemented several cost-cutting measures, such as restructuring the organization, cutting floor space in all stores, reducing product ranges, and firing top IT executives .
- In 2016 , they shifted their head office from Sydney to Melbourne, siting lower real estate costs as one of the factors.
In 2020, David Jones closed 48 stores ; in 2021, they sold two properties worth A$620M to free up capital.
GE Matrix Example (Grow Strategy): Netflix
Nowadays, Netflix, the online streaming company that revolutionized the entertainment industry, is a household name.
However, when Netflix released its streaming service in 2007 , it made up a tiny portion of the company’s revenue, offering 1,000 titles for streaming, compared to the 70,000 titles in physical DVD format.
Here’s an example of how Netflix’s streaming SBU might have looked in 2007.

In 2010 , Blockbuster, Netflix’s largest competitor, filed for bankruptcy, further propelling its online entertainment streaming industry dominance.
As internet speeds increased, technology improved, and consumer preferences shifted towards streaming, Netflix’s video-on-demand service SBU would have moved to an aggressive growth strategy block on the GE Matrix.

Netflix continued its growth path and rapidly expanded between 2012 and 2021:
- In 2012 , the platform had 20 million subscribers, consumed 30% of all residential US bandwidth, and launched in the UK.
- By 2018 , Netflix had 125 million subscribers and a market value of $151 B.
- In 2020, Netflix added 36 million subscribers to its user base and had a net income of $2.76 B .
Advantages of GE Matrix
The advantages of GE Matrix are:
- A simplified approach to portfolio analysis and investment allocation decisions
- Highly replicable and consistent framework
- Applicable across different industries
- An efficient method of determining strategic paths for multiple SBUs
- Helps measure and map the strategic position of SBUs
- Helps understand which businesses are making a profit and which aren’t
Limitations of GE Matrix
The possible limitations of GE Matrix are:
- The GE Matrix is only a snapshot of your portfolio’s performance
- It relies on subjective estimations of market attractiveness and business strength
- Lacks nuance in differentiating between SBUs
- Teams may need to do more research before they can make investment decisions
- May not be suited for emerging or rapidly-evolving industries
When Is The GE Matrix Framework The Best Choice?
While the GE Matrix doesn’t offer a complete picture of SBU performance, its simple design means that strategic thinkers can quickly get a snapshot of how different businesses or product portfolios are performing.
Strategic portfolio management , PMOs , and corporate-level decision-makers will benefit from using the GE Matrix to inform their strategic investment planning.
Recommended reading: How successful PMOs deliver value and avoid the hot seat
GE Matrix + Strategy Execution = 🚀
GE Matrix and other strategic frameworks are great for fleshing out your strategy, but to successfully execute strategy and adapt as needed, you also need the right software.
A great strategy execution platform will help you to create a single source of truth for your strategy, eliminating wasted time in disconnected spreadsheets , confusion and potentially preventing a failed strategy execution. A single home for your strategy will help you to keep everyone on the same page, allowing leaders to focus on the most critical parts of strategy execution: robust goals, context, and strategic thinking.
And when you are not wasting time in meetings to keep everyone aligned, you can focus on maximizing the ROI from your portfolio.
Cascade makes it easy to build strategic portfolio plans and assign KPIs and owners to drive accountability. It lets your team collaborate on shared goals to drive strategy execution across the organization.
Interested in seeing Cascade in action? Get started for free or book a demo with Cascade’s expert.
FAQs About GE Matrix
Who created the ge matrix.
The GE Matrix was created for General Electric by McKinsey in the 1970s to help decision-makers with investment decisions about their various SBUs.
What is the difference between the GE and the BCG Matrix?
The GE Matrix is used by businesses to prioritize investments and looks at industry attractiveness and SBU strength. Boston Consulting Group’s BCG Matrix is used to deploy resources and looks at the product growth rate and market share for SBUs.
Is the GE Matrix better than the BCG?
No, the GE Matrix and BCG Matrix have different purposes. Depending on your current needs, one may be better than the other. However, both are useful tools for strategic planning .
Popular articles

Viva Goals Vs. Cascade: Goal Management Vs. Strategy Execution

What Is A Maturity Model? Overview, Examples + Free Assessment
How To Implement The Balanced Scorecard Framework (With Examples)

The Best Management Reporting Software For Strategy Officers (2024 Guide)
Your toolkit for strategy success.

GE McKinsey Matrix

GE-McKinsey nine-box matrix is a strategy tool that offers a systematic approach for the multi-business corporation to prioritize its investments among its business units. [1]
GE-McKinsey is a framework that evaluates business portfolio, provides further strategic implications and helps to prioritize the investment needed for each business unit (BU). [2]
What is GE McKinsey Matrix
In the business world, much like anywhere else, the problem of resource scarcity is affecting the decisions the companies make. With limited resources, but many opportunities to use them, businesses need to choose how to use their cash best.
The fight for investments takes place at every level of the company: between teams, functional departments, divisions or business units. The question of where and how much to invest is an ever-going headache for those who allocate the resources.
How does this affect the diversified businesses? Multi-business companies manage complex business portfolios, often, with as many as 50, 60 or 100 products and services. The products or business units differ in what they do, how well they perform, or what their future prospects are.
This makes it very hard to make a decision on which products the company should invest. At least, it was hard until the BCG matrix and its improved version, the GE-McKinsey matrix came to help. These tools solved the problem by comparing the business units and assigning them to the groups that are worth investing in or the groups that should be harvested or divested.

In the 1970s, General Electric was managing a huge and complex portfolio of unrelated products and was unsatisfied with the returns from its investments in the products. At the time, companies usually relied on projections of future cash flows, future market growth or some other future projections to make investment decisions, which was an unreliable method to allocate resources.
Therefore, GE consulted McKinsey & Company and as a result the nine-box framework was designed. The nine-box matrix plots the BUs on its 9 cells that indicate whether the company should invest in a product, harvest/divest it or do further research on the product and invest in it if there are still some resources left. The BUs are evaluated on two axes: industry attractiveness and the competitive strength of a unit.
Industry Attractiveness
Industry attractiveness indicates how hard or easy it will be for a company to compete in the market and earn profits. The more profitable the industry is, the more attractive it becomes. When evaluating the industry attractiveness, analysts should look at how an industry will change in the long run rather than in the near future, because the investments needed for the product usually require long-lasting commitment.
Industry attractiveness consists of many factors that collectively determine the competition level in it. There’s no definite list of which factors should be included to determine industry attractiveness, but the following are the most common: [1]
- Long-run growth rate
- Industry size
- Industry profitability: entry barriers, exit barriers, supplier power, buyer power, threat of substitutes and available complements (use Porter’s Five Forces analysis to determine this)
- Industry structure (use Structure-Conduct-Performance framework to determine this)
- Product life cycle changes
- Changes in demand
- Trend of prices
- Macro environment factors (use PEST or PESTEL for this)
- Seasonality
- Availability of labor
- Market segmentation
Competitive strength of a business unit or a product
Along the X axis, the matrix measures how strong, in terms of competition, a particular business unit is against its rivals. In other words, managers try to determine whether a business unit has a sustainable competitive advantage (or at least a temporary competitive advantage ) or not. If the company has a sustainable competitive advantage, the next question is: “For how long will it be sustained?”
The following factors determine the competitive strength of a business unit:
- Total market share
- Market share growth compared to rivals
- Brand strength (use brand value for this)
- Profitability of the company
- Customer loyalty
- VRIO resources or capabilities (use VRIO framework to determine this)
- Your business unit strength in meeting industry’s critical success factors (use Competitive Profile Matrix to determine this)
- Strength of a value chain (use Value Chain Analysis and Benchmarking to determine this)
- Level of product differentiation
- Production flexibility
- Helps to prioritize the limited resources in order to achieve the best returns.
- Managers become more aware of how their products or business units perform.
- It’s more sophisticated business portfolio framework than the BCG matrix.
- Identifies the strategic steps the company needs to make to improve the performance of its business portfolio.
Disadvantages
- Requires a consultant or a highly experienced person to determine industry’s attractiveness and business unit strength as accurately as possible.
- It is costly to conduct.
- It doesn’t take into account the synergies that could exist between two or more business units.
Difference between GE McKinsey and BCG matrices
GE McKinsey matrix is a very similar portfolio evaluation framework to the BCG matrix. Both matrices are used to analyze a company’s product or business unit portfolio and facilitate investment decisions.
The main differences:

- Comprehensiveness . The reason why the GE McKinsey framework was developed is that the BCG portfolio tool wasn’t sophisticated enough for the guys from General Electric. In the BCG matrix, the competitive strength of a business unit is equal to the relative market share, which assumes that the larger the market share a business has the better it is positioned to compete in the market. This is true, but it’s too simplistic to assume that it’s the only factor affecting the competition in the market. The same is true with industry attractiveness that is measured only as the market growth rate in BCG. It comes as no surprise that GE, with its complex business portfolio, needed something more comprehensive than that.
Using the tool
There are no established processes or models that managers could use when performing the analysis. Therefore, we designed the following steps to facilitate the process:
Step 1. Determine industry attractiveness of each business unit
- Make a list of factors. The first thing you’ll need to do is to identify, which factors to include when measuring industry attractiveness. We’ve provided the list of the most common factors, but you should include the factors that are the most appropriate to your industries.
- Assign weights. Weights indicate how important a factor is to industry’s attractiveness. A number from 0.01 (not important) to 1.0 (very important) should be assigned to each factor. The sum of all weights should equal to 1.0.
- Rate the factors. The next thing you need to do is to rate each factor for each of your products or business units. Choose the values between ‘1-5’ or ‘1-10’, where ‘1’ indicates the low industry attractiveness and ‘5’ or ‘10’ high industry attractiveness.
- Calculate the total scores. Total score is the sum of all weighted scores for each business unit. Weighted scores are calculated by multiplying weights and ratings. Total scores allow for a comparison of industry attractiveness for each business unit.
Industry Attractiveness (1/2)
Industry attractiveness (2/2).
This is a tough task and one that usually requires involving a consultant who is an expert in the industries in question. The consultant will help you to determine the weights and to rate them properly so the analysis is as accurate as possible.
Step 2. Determine the competitive strength of each business unit
‘Step 2’ is the same as ‘Step 1’ only this time, instead of industry attractiveness, the competitive strength of a business unit is evaluated.
- Make a list of factors. Choose the competitive strength factors from our list or add your own factors.
- Assign weights. Weights indicate how important a factor is in achieving sustainable competitive advantage. A number from 0.01 (not important) to 1.0 (very important) should be assigned to each factor. The sum of all weights should equal to 1.0.
- Rate the factors. Rate each factor for each of your product or business units. Choose the values between ‘1-5’ or ‘1-10’, where ‘1’ indicates the weak strength and ‘5’ or ‘10’ powerful strength.
- Calculate the total scores. See ‘Step 1’.
Competitive Strength (1/2)
Competitive strength (2/2), step 3. plot the business units on a matrix.

With all the evaluations and scores in place, we can plot the business units on the matrix. Each business unit is represented as a circle. The size of the circle should correspond to the proportion of the business revenue generated by that business unit.
For example, ‘Business unit 1’ generates 20% of the revenue and ‘Business unit 2’ generates 40%of the revenue for the company. The size of a circle for ‘Business unit 1’ will be half the size of a circle for ‘Business unit 2’.
Step 4. Analyze the information

There are different investment implications you should follow, depending on which boxes your business units have been plotted. There are 3 groups of boxes: investment/grow, selectivity/earnings and harvest/divest boxes. Each group of boxes indicates what you should do with your investments.
Investment implications
Invest/Grow box. Companies should invest into the business units that fall into these boxes as they promise the highest returns in the future. These business units will require a lot of cash because they’ll be operating in growing industries and will have to maintain or grow their market share.
It is essential to provide as much resources as possible for BUs so there would be no constraints for them to grow. The investments should be provided for R&D, advertising, acquisitions and to increase the production capacity to meet the demand in the future.
Selectivity/Earnings box. You should invest into these BUs only if you have the money left over the investments in invest/grow business units group and if you believe that BUs will generate cash in the future.
These business units are often considered last as there’s a lot of uncertainty with them. The general rule should be to invest in business units that operate in huge markets and there are not many dominant players in the market, so the investments would help to easily win larger market share.
Harvest/Divest box. The business units that are operating in unattractive industries, don’t have sustainable competitive advantages or are incapable of achieving it and are performing relatively poorly fall into harvest/divest boxes. What should companies do with these business units?
First, if the business unit generates surplus cash, companies should treat them the same as the business units that fall into the ‘cash cows’ box in the BCG matrix. This means that the companies should invest into these business units just enough to keep them operating and collect all the cash generated by it. In other words, it’s worth to invest into such a business as long as investments into it doesn’t exceed the cash generated from it.
Second, the business units that only make losses should be divested. If that’s impossible and there’s no way to turn the losses into profits, the company should liquidate the business unit.
Step 5. Identify the future direction of each business unit
The GE McKinsey matrix only provides the current picture of industry attractiveness and the competitive strength of a business unit and doesn’t consider how they may change in the future.
Further analysis may reveal that investments into some of the business units can considerably improve their competitive positions or that the industry may experience major growth in the future. This affects the decisions we make about our investments into one or another business unit.
For example, our previous evaluations show that the ‘Business Unit 1’ belongs to invest/grow box, but further analysis of an industry reveals that it’s going to shrink substantially in the near future.
Therefore, in the near future, the business unit will be in the harvest/divest group rather than invest/grow box. Would you still invest as much in ‘Business Unit 1’ as you would have invested initially? The answer is no and the matrix should take that into consideration.
How to do that? Well, the company should consult with the industry analysts to determine whether the industry attractiveness will grow, stay the same or decrease in the future. You should also discuss with your managers whether your business unit’s competitive strength will likely increase or decrease in the near future.
When all the information is collected you should include it to your existing matrix, by adding the arrows to the circles. The arrows should point to the future position of a business unit.
The following table shows how industry attractiveness and business unit competitive strength will change in 2 years.

Step 6. Prioritize your investments
The last step is to decide where and how to invest the company’s money. While the matrix makes it easier by evaluating the business units and identifying the best ones to invest in, it still doesn’t answer some very important questions:
- Is it really worth investing into some business units?
- How much exactly to invest in?
- Where to invest into business units (more to R&D, marketing, value chain?) to improve their performance?
Doing the GE McKinsey matrix and answering all the questions takes time, effort and money, but it’s still one of the most important product portfolio management tools that significantly facilitate investment decisions.
- McKinsey & Company (2008). Enduring Ideas: The GE–McKinsey nine-box matrix.
- David, F.R. (2009). Strategic Management: Concepts and Cases. 12th ed. FT Prentice Hall
- Wiki (2008). BCG Matrix & GE/McKinsey Matrix.
- McKinsey 7S Model
- Competitive Profile Matrix (CPM)
- Boston Consulting Group (BCG) Growth-Share Matrix
- Ansoff Matrix Explained
Leave a Comment Cancel reply
Save my name and email in this browser for the next time I comment.

The Leading Source of Insights On Business Model Strategy & Tech Business Models

What Is The GE McKinsey Matrix And Why It Matters In Business
The GE McKinsey Matrix was developed in the 1970s after General Electric asked its consultant McKinsey to develop a portfolio management model. This matrix is a strategy tool that provides guidance on how a corporation should prioritize its investments among its business units, leading to three possible scenarios: invest, protect, harvest, and divest.
Table of Contents
Understanding the GE McKinsey Matrix
The GE McKinsey Matrix is fundamentally a portfolio analysis.
That is, it compares groups of products with their competitive power and market attractiveness.
The portfolios themselves are comprised of the full suite of products or services that a business offers to the market.
In the context of General Electric, the matrix was created so that the company could analyze the composition of each of its 150 portfolios – otherwise known as strategic business units (SBUs).
The GE McKinsey Matrix allows a large, decentralized company to determine where best to invest its cash.
It does this by allowing the company to judge each SBU according to whether it will do well in the future.
That is, the attractiveness of the industry and the SBU’s competitive strength in that industry.
Drivers of the GE McKinsey Matrix
Before any business can plot their products on the matrix, they must first define both competitive advantage and industry attractiveness.
Competitive advantage may include:
- Actual market share and market share growth potential.
- Profit margins, cash flow, and manufacturing costs.
- Brand equity and customer loyalty.
- Product or service uniqueness.
Industry attractiveness includes:
- Market size and the potential for growth .
- Buyer and supplier power.
- The potential for new entrants (competition) or substitution with another product.
- Industry profitability.
- Entry and exit barriers.
Structure of the GE McKinsey Matrix
The matrix comprises two axes.
The competitive strength of the individual SBUs is represented on the x-axis while market attractiveness is represented on the y-axis.
Both competitive strength and market attractiveness are determined by a weighted score calculated from the relevant factors that apply to each.
Each parameter is further divided into three categories – low, medium, and high.
This creates a matrix with a total of nine cells.
To calculate a weighted score for each SBU, follow these steps:
Make a list of factors
What are the competitive strength and market attractiveness features that are most relevant to the organization?
Refer to the previous section for examples.
Attribute weights
These define the relative importance of each factor.
The scale that is used is up to the discretion of the business.
For example, one may use a value of 1 to denote extreme unimportance with a value of 100 denoting extreme importance.
In this case, the individual weights that are assigned to each factor should add up to 100.
Rate the factors
Then, rate the factors according to how well each SBU satisfies them.
Most businesses use a scale of 1 to 10.
For example, one SBU may score a 6 for industry size while a smaller industry may score a 3.
Calculate total scores
To arrive at a total score for each SBU, multiply the weight assigned in step two with the rating assigned in step three.
Market segmentation for one SBU that is weighted at 17 and rated at 5, for example, receives a score of 85.
Repeat the process for each factor and sum each score to arrive at a total score.
Plot the scores on the matrix
With the total scores identified for industry attractiveness and competitive strength, the x and y -values of each SBU can be plotted on the matrix using a circle.
The size of each circle should correspond to how much revenue the small business unit generates.
That is, an SBU that generates 40% of company revenue should be twice the size of an SBU that generates 20% of revenue.
Note also that the nine cells are divided by a diagonal line running from the bottom left to the top right of the matrix.
When a product is placed on the matrix, its position relative to the diagonal line determines the strategy that should be used.
Products that fall above the diagonal line tend to be better performers with high growth or cash flow potential.
Conversely, products that fall below the line tend to have little potential for growth and are costing the company money to sell.
Strategic implications of the matrix
With each SBU plotted on the matrix, the business can choose one of three strategies according to whether it has low, medium, or high competitive strength and industry attractiveness.
Let’s take a look at these below.
Grow/invest strategy
A growth strategy is prudent when a product has a competitive advantage in an attractive market.
Investment in growth and a focus on maintaining strengths is a priority. Profitability can also be increased with an emphasis on productivity.
This is a position every business aspires to and is characterized by moderate to high industry attractiveness and moderate to high competitive strength.
The biggest challenge for businesses in this area of the matrix is a lack of assets or capital that prevents growth or hinders it from maintaining a dominant market position.
For those who can afford to do so, growth strategies may involve increasing production capacity, targeting new consumer demographics, or mergers and acquisitions.
Hold strategy
A hold strategy occurs when a product has both average competitive advantage and market attractiveness.
The way forward, in this case, is a little more difficult to define than in the previous example.
Depending on the outlook of the company, it could either shift to a more attractive industry or strive to improve its competitive position in the current industry.
If the business decides to improve the current competitive position of one of its SBUs, it should only do so if there is capital leftover from investments in the grow/invest strategy .
Harvest strategy
If the product is at a competitive disadvantage and resides in an unattractive industry, a harvest strategy should be employed.
This means investing just enough capital to keep the SBU afloat and continuing to invest as long as the investment made does not exceed the cash that is generated.
Business units that are making a loss, on the other hand, should be sold as soon as possible or when the cash value is at its peak.
These strategies ensure that low-viability products do not negatively impact other, more profitable SBUs.
Advantages of using the GE Matrix

The GE Matrix is a great tool that introduces a more scientific method to business strategy .
Indeed, the GE Matrix helps clarify the business landscape and, based on a set of weights, identify the best strategy to execute.
Thus, its strengths definitely lie in the fact that the GE Matrix is a simple yet more scientific tool to assess the business world beyond gut or instinct.
Disadvantages of using the GE Matrix

The main issue with the GE Matrix is the fact that the way to attribute weights can become very subjective.
Indeed, based on how we attribute weights in analyzing the business landscape, that might also result in a complete misrepresentation of what the business world looks like.
In addition, the GE Matrix, while it introduces a “scientific” element, it also has significant drawbacks, given the fact that it looks at the business world in a linear fashion.
This simplification works to simplify the execution of a strategy , yet it can also represent a significant limitation.
That is why the GE Matrix needs to be balanced with other heuristic-based tools and also on the intuition of the business person or team of people who is in charge of the strategy and execution.
In short, the GE Matrix is a great tool to avoid getting stuck, prioritize a strategy and enable execution.
Yet, to be effective, it needs to be balanced with heuristics and intuition about the business landscape.
Key Highlights About The GE McKinsey Matrix
- Development and Purpose : The GE McKinsey Matrix was developed in the 1970s by General Electric in collaboration with McKinsey & Company. It serves as a portfolio management tool to guide a corporation in prioritizing its investments among different business units or strategic business units (SBUs).
- Portfolio Analysis : The matrix compares different products or services within a company’s portfolio based on their competitive strength and market attractiveness. It helps companies assess which SBUs are worth investing in for future growth .
- Factors and Attributes : Competitive advantage factors include market share, growth potential, profit margins, brand equity, etc. Industry attractiveness factors include market size, growth potential, competition, and industry profitability.
- Matrix Structure : The matrix consists of two axes: competitive strength (x-axis) and market attractiveness (y-axis). Both axes are divided into low, medium, and high categories. The matrix is divided into nine cells.
- Scoring and Positioning : Each SBU’s competitive strength and market attractiveness are scored based on relevant factors and attribute weights. The scores determine the SBU’s position on the matrix, often represented by circles. The size of the circle indicates revenue generated.
- Grow/Invest Strategy : Used for SBUs with high competitive strength and high industry attractiveness. Focus on growth , maintaining strengths, and increasing profitability.
- Hold Strategy : Applied when an SBU has average competitive advantage and market attractiveness. Decision to shift to a more attractive industry or improve competitive position.
- Harvest Strategy : Employed for SBUs with low competitive strength and low industry attractiveness. Minimize investment while generating cash or divest if the SBU is not viable.
- Advantages of the Matrix : The GE Matrix provides a structured approach to business strategy , offering a more scientific method than relying solely on instinct. It clarifies the business landscape and helps identify the best strategic approach.
- Disadvantages of the Matrix : Assigning weights to factors can be subjective, potentially leading to misrepresentations. The matrix’s linear perspective oversimplifies the business world, necessitating balance with heuristic-based tools and business intuition.
GE McKinsey matrix vs. BCG matrix

The Boston Consulting Group (BCG) matrix is another tool businesses use to guide long-term strategic planning across multiple business units.
The matrix was developed by Bruce D. Henderson in 1968 and served as the template for the GE McKinsey matrix in the following decade.
As a result, the two matrices are similar but with a few key differences which are outlined below.
The GE matrix is a multifactor portfolio matrix that tells a firm which strategy to follow based on the position a product occupies in the grid.
The matrix has nine cells that account for varying degrees of industry attractiveness and competitive advantage.
The earlier BCG matrix, on the other hand, is more primitive.
It features only four cells and categorizes products according to their relative market share and growth rate. Each cell, or quadrant, is described as follows:
- Dogs – low market share/low market growth .
- Question marks – low market share/high market growth.
- Stars – high market share/high market growth.
- Cash cows – high market share/low market growth.
Level of detail
The GE McKinsey matrix provides concrete instruction on how a business can calculate industry attractiveness and competitive advantage or business unit strength.
As noted earlier, the organization lists important factors and then assigns a weighting to each.
The resultant calculation then yields x and y values that can be plotted on the matrix to determine the best course of action moving forward.
The BCG matrix does not clarify how market share and market strength should be calculated.
In fact, one of the main criticisms of the matrix is that it is too simplistic.
Smaller businesses with market shares that are too small to quantify may also find that the BCG matrix is unsuitable for their needs.
The nine-box GE matrix features three different strategies that in some interpretations are color-coded in the following way:
- Grow/invest (green) – any product that falls in a green box is representative of a business in a good position.
- Hold (amber) – with the way forward more difficult to define, these boxes require the skilled decision-making of experienced personnel.
- Harvest (red) – these products require close attention because they have the potential to negatively impact the company’s bottom line.
Strategies here are based on strong, average, and weak competitive advantage and high, medium, and low industry attractiveness.
Conversely, the less versatile BCG matrix is mostly concerned with identifying the business units where investment should be prioritized.
Market share and market growth are only measured in terms of high or low, which makes the resultant strategy far more general and imprecise:
- Dogs – in most cases, these products should be removed from the portfolio because they are a drain on resources.
- Question marks – as the name suggests, these are products that may or may not respond to increased investment. Some may turn into stars, while others will turn into dogs or fall somewhere in between.
- Stars – or products that require ongoing investment to sustain market dominance.
- Cash cows – these are mature, well-established products that should be “milked” as long as possible.
GE matrix vs. Ansoff matrix

Where the GE matrix is a useful tool to prioritize specific business units, the Ansoff Matrix helps to make sense of whether to prioritize four kinds of strategies ( market penetration , market development , product development, or diversification) to grow the business and create competitive moats.
Indeed, the Ansoff matrix will help to assess whether it’ll make sense to leverage new or existing products while looking into new or existing markets, and based on that, it devises four different types of strategies:
- Market penetration
- Market development
- Product development
- Diversification
GE Matrix and SWOT Analysis

With the GE Matrix, we can build a prioritization pipeline to understand what initiatives and products the company can push forward.
On the other hand, by coupling the GE Matrix with the SWOT analysis , you can assess and prioritize initiatives by looking at the internal context (strengths and weaknesses) and external context (opportunities and threats).
Through the four SWOT elements:
- Opportunities
This might give you a further qualitative assessment of the business landscape in which you can prioritize your business initiatives.
GE Matrix and Porter’s Five Forces

The GE Matrix can also be coupled with another tool, like Porter’s Five Forces , to assess the competitive landscape through five main elements:
- Competitive rivalry
- Barriers to entry
- Bargaining power of suppliers
- Bargaining power of customers
- Threats of substitute products or services
With this further quantitative assessment, you can define what the competition looks like in the current market’s landscape and what initiatives make more sense based on this external environment!
GE matrix of Apple
Apple is in the enviable position of operating in several highly attractive industries with a strong competitive position.
Contributing around 50% of total company revenue and $42.62 billion in Q3 2022 alone , the iPhone remains the company’s most dominant product.

Despite the lucrative iPhone market, however, there is still room for improvement.
Around 72% of all smartphones run on Android, but research shows that Apple is gaining traction in the critical Chinese market.

Almost 10 million iPhones were shipped to the country – the largest smartphone market in the world – beating out a host of Chinese-owned competitors.
The company’s services category is experiencing the most growth and investment.
The category, which includes Apple TV+, AppleCare, Apple Pay, and the App Store (among others) earned $19 billion in Q3 2022 with the company reporting over 900 million paying subscribers.
These numbers represent an increase of $1 billion compared to Q3 2021 or an extra 155 million paying customers.
Apple has been the leading tablet seller between 2011 and 2022 with the iPad enjoying 37.5% of the global market.
However, market analyst firm Canalys reported recently that the market itself has experienced an 11% year-over-year decline and has shrunk for the past four years.
The reasons for this decline are likely to be multifaceted. One explanation is that the increasing size and functionality of smartphones have made them a more attractive alternative.
Another reason is that the popularity of the market is not sustainable.
Adoption of the tablet exploded initially, but with many holding onto their iPads for several years before considering another purchase, growth in the market has stalled and reversed.
The future of the iMac and associated peripherals were also unclear for a time.
But almost inexplicably, the iMac is one of the few success stories in a rapidly shrinking PC market.
Apple saw a 40.2% increase in PC sales for Q3 2022 over the same quarter in 2021.
However, the company only enjoys moderate competitive strength and is placed fourth for sales behind powerhouses Lenovo, HP, and Dell.
In some respects, the iPod and its many derivations made Apple what it is today.
In the modern era, however, the market is almost non-existent and the iPod touch remains the only product the company still sells.
Considering the rise of Spotify and other streaming services, Apple also announced in mid-2019 that iTunes would be discontinued after 18 years.
The product would be harvested with the release of macOS Catalina and replaced by three apps with different purposes: Apple TV, Apple Podcasts, and Apple Music.
While iTunes would be no more on Apple devices, the company noted that its revolutionary iTunes Store would live on and exist on the sidebar in the new Music app.
Downloaded movies and TV shows, on the other hand, would intuitively be found in the Apple TV app.
iTunes itself would also still be available for Windows users.
GE matrix of The Coca-Cola Company
The original and iconic Coca-Cola beverage is still the company’s top seller around the world.
However, 43% of this market is now comprised of low or no-sugar derivates such as Coca-Cola Zero Sugar, Coca-Cola Life, and Diet Coke.
Coca-Cola’s dominant position in this market has never been in doubt, but it has been forced to develop new products that appeal to more health-conscious consumers.
This growth strategy appears to have paid off, with Zero Sugar enjoying double-digit growth in 2018 in a wider market forecast to enjoy a CAGR of 7.8% until 2028 .
Coca-Cola has also made several acquisitions as it seeks to take advantage of this trend.
The company prefers to acquire smaller, ready-made start-ups such as Honest Tea, Fairlife Dairy, and Suja Life LLC – a manufacturer of processed juices and kombucha.
While many of Coca-Cola’s carbonated beverages enjoy a competitive advantage in attractive markets, the long-term viability of these brands is uncertain.
From a peak of 50 gallons per person in 1999, per capita soft drink consumption in the United States has been on a slow but steady decline to now sit at 39.3 gallons per person .
This trend, as we noted above, is the result of more health-conscious consumers. But it is also important to note that the input prices for carbonated soft drinks have also increased recently.
Higher oil prices, for example, have seen demand for alternative fuels such as ethanol increase. Since ethanol is made using corn and sugar products, the price for these products has also increased.
One product in particular – high-fructose corn syrup – is used in both ethanol and soft drink production.
It is unlikely the carbonated soft drink market will ever decline to a point where it becomes unprofitable.
Nevertheless, the extent to which the market declines (and whether growth in the healthy drink market can compensate) remains to be seen.
The Coca-Cola Company has been in continuous operation for over 130 years and has had its fair share of failed or questionable products.
In Japan in 2020, the company debuted its Go: Good line of canned soup available in vending machines and served hot.
The product is billed as a healthier, low-salt alternative, but it nevertheless occupies the low market share, low market attractiveness area of the GE matrix.
Coca-Cola was also forced to harvest its Dasani line of bottled water in the United Kingdom.
Whilst Dasani has been relatively successful in the United States, English consumers reacted unfavorably when they realized that water was sourced from a tap in London and not from the virgin forest on the bottle’s label.
GE McKinsey matrix of Volkswagen
Volkswagen is a German automotive manufacturer that was founded in 1937 by the German Labour Front with a mission to make vehicles more affordable for working-class citizens.
The company is best known for its iconic Beetle, with its 80-year production run finally ending in Mexico in July 2019.
Today, Volkswagen is a dominant force in the automotive industry with a portfolio of 10 core brands across sports cars, passenger cars, motorcycles, and commercial vehicles .
The company also manages additional brands and business units that offer vehicle financing and leasing.
Let’s take a look at some of these brands in the context of the GE McKinsey matrix below.
Volkswagen Passenger Cars is by far the company’s most valuable brand with 2.719 million vehicles sold in 2021 .
Some 453,000 of these sales were electric vehicles, representing an increase of 95% over the previous year.
Like most of its competitors, Volkswagen is investing heavily in electric vehicles.
In releasing its Q1 2022 results, the company announced a growth strategy to achieve a 10% market share of battery-electric vehicles (BEVs) in the United States.
To achieve this, the Volkswagen Passenger Cars brand will feature 25 separate models by the end of this decade with $7.1 billion slated to be invested in BEV research, development, and manufacturing .
This investment forms part of the company’s New Auto – Mobility for Generations to Come strategy which also encompasses fully networked autonomous transportation.
Seat is a brand that may be classified as average market attractiveness and competitive advantage.
The brand was the fourth most popular for Volkswagen in 2021 with 494,000 vehicles sold , with the vehicle more popular in Germany and the United Kingdom than in its home country of Spain.
Elsewhere, Seat has had mixed success. In a similar way that Skoda gained a foothold in India, Seat has been a strong representative of VW in North Africa.
However, a move to enter the Chinese market with a small, low-cost EV was ultimately thwarted by a looming recession, reduced governmental incentives, and continued COVID-19 lockdowns.
Despite sales in the brand increasing by 10% in 2021 with the addition of a new sports model, the brand reported an operating loss of €371 million .
Seat president Wayne Griffiths blamed the loss on a semiconductor shortage which resulted in a decrease in production volume.
While Volkswagen has not harvested any specific brands in their entirety, it did announce in April 2022 that around 60 petrol and diesel models across several brands would be scrapped to focus on more profitable electric vehicles.
The measure was also seen as a reversal of the company’s previous global dominance strategy , where it flooded the unprofitable North and South American markets with new models amidst heavy financial losses.
This quasi-harvest strategy will allow Volkswagen to remove the less profitable models of some brands and keep the products with higher margins and higher potential.
The so-called “survivors” will then receive more attention, more investment, and more focus and become integral parts of the company’s sustainable EV growth strategy moving forward.
GE matrix of Nestle
Nestle is a multinational food and drink conglomerate corporation headquartered in Vevey, Switzerland.

The company, which owns 29 brands with sales of at least $1 billion and more than 2,000 brands in total , sells products such as baby food, bottled water, breakfast cereals, pet food, snacks, coffee, healthcare nutrition, and confectionery.
With thousands of brands in multiple industries and markets, we consider Nestle to be an ideal candidate for a GE-McKinsey matrix analysis.
The results of this analysis posit that a brand has three potential courses of action according to where each is positioned in the matrix itself.
These alternatives are the grow/invest, hold, and harvest strategies.
Let’s take a look at each of these with respect to some of Nestle’s brands.
Growth or investment strategies are suited to products that have a competitive advantage in an attractive industry that may be characterized by size, growth potential, profitability, and the presence of entry barriers.
As the largest food company in the world, it is perhaps no surprise that Nestle has many product brands in this section of the matrix.
Nestle’s instant coffee brand Nescafe is, according to Forbes, its largest brand with a valuation of $20.4 billion alone .
Nescafe has dominated the instant coffee market since it was introduced in the Second World War to U.S. soldiers, using its previous expertise in milk processing to offer a product now available in more than 180 countries.
Hold strategies are reserved for products characterized by average competitive advantage and market attractiveness.
As a result, a specific course of action is a little harder to identify and depends on the specific ideals of the company in question.
Nestle Milo is a chocolate-flavored malt drink that is normally mixed with milk or hot water.
The drink was invented in Australia in 1934 where it remains the most popular drink in a relatively small market.
However, Milo is also a staple in Malaysia and popular in other parts of South Asia such as Singapore and Japan.
Milo has been released in other countries such as Portugal, Brazil, and the United Kingdom to limited success and is not available at all in the lucrative United States market.
In other areas, it competes directly with fellow Nestle drink brand Nesquik.
As of February 2022, Nestle is looking to expand its presence in the popular South Asia region with a new soy-based version of Milo.
Since over 40% of Thai consumers consume plant-based diets , this may be a way for the brand to increase its market share and industry attractiveness in the country and indeed the broader region.
When a product resides in an unattractive industry at a competitive disadvantage, a harvest strategy should be employed.
Products that break even should be dedicated just enough capital to remain afloat, while loss-making products should be discontinued.
Nestle has a long list of products that have been discontinued for whatever reason.
A low sugar version of its popular white chocolate Milkybar was pulled from sale in 2020 just two years after it was launched because of a disagreeable taste.
The company also phased out a line of smoothies after four months in a joint-venture with juice company Boost.
Other products to have suffered the same fate include hot cocoa mixes, power bars, and flavored mineral waters.
Nestle has several brands in this area of the GE matrix for a couple of reasons.
Like any sizeable company, its failed innovations are more numerous than other companies with smaller budgets.
But there is a far more significant reason: Nestle is a multinational food company in a market that now demands healthy and nutritious food.
Since much of Nestle ‘s success has been built on confectionery and other unhealthy foods, the company has found it difficult to shift its brand perception among consumers.
The company even went as far as acknowledging that over 60% of its food and drink options did not meet a “ recognized definition of health ”.
In response to the shift toward healthier food, Nestle sold its entire confectionery business in the United States in 2018 to Ferrero for $2.8 billion.
Key takeaways from Nestle case study:
- Nestle is a multinational food and drink conglomerate corporation headquartered in Vevey, Switzerland. The company owns 29 brands with sales of at least $1 billion and over 2,000 brands in total.
- Nestle’s instant coffee brand Nescafe is a dominant brand in over 180 countries around the world. Flavored malt drink Milo is a brand that has average market attractiveness and competitiveness since most sales are confined to Asia and Oceania.
- As a company built on the back of unhealthy food item sales, Nestle has several brands in the harvest strategy of the GE matrix. These include power bars, cocoa mixes, confectionary, and smoothies.
Nestle SWOT Analysis
Another way to look at Nestle is to look at it through the SWOT Analysis .

GE matrix of P&G

In this case study, we’ll analyze the consumer-packaged-goods multinational Procter & Gamble.
Procter & Gamble owns 21 brands that generate more than $1 billion in sales . Examples of these brands (which can be found in each of the company’s five segments) include:
- Beauty – Head & Shoulders, Herbal Essences, SK-II, Olay, and Pantene.
- Grooming – Braun and Gillette.
- Health Care – Crest, Oral B, and Vicks.
- Fabric & Home Care – Ariel, Downy, Gain, Tide, Cascade, Dawn, Fairy, and Febreze.
- Baby, Feminine & Family Care – Luvs, Pampers, Always, Bounty, Charmin.
Procter & Gamble has looked to capitalize on its dominant position in numerous markets with innovations that solve everyday problems. In 2021, nine of the company’s products were featured in the top 25 of market research firm IRI’s New Product Pacesetters list.
The list details the most successful non-food product launches and featured new P&G products that were variations of billion-dollar brands. Examples included Dawn Platinum Powerwash, Febreze LIGHT, Febreze Auto, Crest Whitening Emulsions, Tide Hygienic Clean, and Olay Regenerist Collage Peptide 24.
While Braun and Gillette are both billion-dollar brands, they only possess a moderate competitive advantage in the United States and, together with women’s brand Venus, contributed just 8% of the company’s 2022 net sales.
In the aforementioned razor market, Gillette and Venus rank #3 and #6 for sales with Braun not featuring in the top 10. These brands face stiff competition from the likes of Panasonic ($62.1 billion in sales in 2021) and Philip Morris International ($31.4 billion) whose diverse product ranges compete for sales.
Whether the company should hold these brands to maintain market share or invest in their growth is not clear. Research firm Prescient & Strategic Intelligence predicts the industry will experience a modest CAGR of 0.96% until 2030 and the industry has seen many new entrants as consumer tastes have evolved.
Nevertheless, with two brands in the top 10 in North America and billion-dollar brands in other segments, P&G may be content to hold Braun, Gillette, and Venus for now.
The harvest strategy has been effective for P&G in consumer goods where the lifecycle of a product can be relatively short. Perhaps counterintuitively, some of the company’s most successful products are those that have been harvested.
For example, Pampers diapers has been a staple brand for years and the company has maintained its market dominance via constant innovation. Tide, as we mentioned earlier, is another brand that is refined periodically to maintain its competitive advantage.
Nevertheless, Procter & Gamble has sold several brands over its history to focus on core products and improve performance. Here are some examples:
- Duracell – P&G sold the battery brand Duracell to Berkshire Hathaway in 2016 for $2.9 billion in cash and stock .
- Folgers – the coffee brand was sold to J.M. Smucker Co in 2008 as part of a renewed focus on its core business segments.
- Pringles – P&G sold the snack brand Pringles to Diamond Foods in 2012 for $1.5 billion in stock. The sale marked the end of the company’s association with food, allowing it to focus on its high-margin, high-growth beauty and personal care brands.
Key takeaways
- The GE McKinsey Matrix is a nine-cell portfolio matrix, originally developed for GE as a means of screening their large portfolio of strategic business units.
- The drivers of the GE McKinsey Matrix for a product portfolio are competitive strength and market attractiveness.
- The position of a product on the matrix ultimately decides whether the business should focus on growth or on minimizing investment and selling.
What is GE Matrix used for?
The GE Matrix is a strategic tool that is useful for assessing and prioritizing the development of a portfolio of products for specific business units. The matrix helps corporations prioritize their investments among their business units, leading to three possible scenarios: invest, protect, harvest, and divest.
Is GE matrix better than BCG?
The strength of the BCG Matrix is its simplicity. Both tools help prioritize the investment activities of corporations toward products that can lead to business growth. Whereas the GE Matrix is a bit more complex, the BCG Matrix is a more straightforward tool. Both can be extremely useful for corporations to identify business opportunities and products worth pursuing.
What are the components of GE matrix?
The main components of the GE Matrix comprise:
- Competitive advantage, which may include:
- Actual market share and market share growth potential.
2. Industry attractiveness that includes:
- Market size and the potential for growth .
Related Business Matrices

Hoshin Kanri X-Matrix

Kepner-Tregoe Matrix

Eisenhower Matrix

Action Priority Matrix

TOWS Matrix

GE McKinsey Matrix

Growth Matrix

Ansoff Matrix
Kraljic Matrix

Product-Process Matrix

Mendelow Stakeholder Matrix

Requirements Traceability Matrix

Value/Effort Matrix

Decision Matrix

Cash Flow Statement Matrix

Grand Strategy Matrix

Read Also: RAPID Framework , RACI Matrix , 3×3 Sales Matrix , Value/effort Matrix , SFA matrix , Value/Risk Matrix , Reframing Matrix , Kepner-Tregoe Matrix.
Main Free Guides:
- Business Models
- Business Strategy
- Business Development
- Digital Business Models
- Distribution Channels
- Marketing Strategy
- Platform Business Models
- Revenue Models
- Tech Business Models
- Blockchain Business Models Framework
More Resources

About The Author

Gennaro Cuofano
Discover more from fourweekmba.
Subscribe now to keep reading and get access to the full archive.
Type your email…
Continue reading
- 70+ Business Models
- Airbnb Business Model
- Amazon Business Model
- Apple Business Model
- Google Business Model
- Facebook [Meta] Business Model
- Microsoft Business Model
- Netflix Business Model
- Uber Business Model
GE-McKinsey Matrix
In this article, we introduce the GE-McKinsey matrix and explain with an example how to make, plot and use it. We also compare it with the BCG matrix.
Definition and introduction
McKinsey itself provides a most lucid definition of the GE/McKinsey Matrix:
The GE-McKinsey nine-box matrix is a strategy tool that offers a systematic approach for the multi-business corporation to prioritize its investments among its business units.
In the 1970s, General Electric asked its consultants, McKinsey, to develop a portfolio management model that would suit it needs.
GE, which had about 150 business units under it at that time, had been using the BCG Matrix, but it had eventually felt the need for a more sophisticated framework to help it decide which of the units deserved development funds.
The result was what the business world would come to know as the GE/McKinsey Matrix, a strategy tool that helps a corporation decide whether or not to invest in one of its business units or products.
Like the BCG Matrix, the GE/McKinsey Matrix (“GE Matrix,” henceforth) today helps corporations make investment and disinvestment decisions related to their business units. But unlike the four-grid BCG Matrix, it has nine grids.
Moreover, while the BCG Matrix uses market growth and market share as its dimensions, the GE Matrix uses industry attractiveness and business unit strength as the criteria for its measurements.
If you know how the BCG Matrix works, the following illustration will help you to quickly compare the two matrices.
A corporation can plot its business units (or products) on the GE Matrix on the basis of the attractiveness of the industry concerned and the competitive strength of the units.

GE-McKinsey Matrix explained with an example
The McKinsey Matrix, because of its higher sophistication, is a little more difficult than the BCG Matrix to put into practice. But one can learn to use it by following the five steps given below. Based on the template format introduced earlier, here’s how you can make & use it.
Imagine that we are plotting just two business units, Business Unit A and B, on the GE Matrix.
Step 1. Determine the industry attractiveness of each business unit
List the factors: To determine industry attractiveness, the following are among factors taken into consideration: the industry growth rate, market size, industry profitability, low competition, and PEST factors.
Decide weights: To keep it simple, let us take just three of the factors that make an industry attractive for investments: High profit, industry growth, and low competition.
Now, we need to decide the weight of each factor—that is, how important each factor is—by giving it points from 1 (not important) to 10 (very important).
The total of all the weights should be 10. Let us assume that high profit is the most important of the factors; if so, give it a weight of, say, 5 out of 10.
Give industry growth 3 out of 10, and low competition 2 out of 10 (these are just random weights, given only for example).
So, this means that the possibility of making a high profit is the most important consideration in entering the market, followed by market growth and low competition.
Rate the factors: Now, rate each factor for each business unit on a scale of 1 (not attractive) to 10 (very attractive). Let us say that for Unit A, low competition is the most attractive factor.
If so, it is put at 6 (for example) on the scale. Industry growth and high profit get scores of 4 and 1, respectively, for Unit A. For Unit B, industry growth scores 3, high profit 6, and low competition 1 (the ratings need not add up to 10).
Weighted score: To get the weighted score for each factor of industry attractiveness, we multiply the weight of the factor by the rate for the unit. Here are the weighted scores for Unit A and Unit B.
Unit A: Low competition: 2 (weight) x 6 (rate) = 12. Industry growth: 3 x 4 = 12. High profit: 5 x 1 = 5. Total weighted score for Unit A = 12 + 12 + 5 = 29.
Unit B: Low competition: 2 x 1 = 2. Industry growth: 3 x 3 = 9. High profit: 5 x 6 = 30. Total weighted score for Unit B = 2+ 9 + 30 = 41.
Step 2. Determine the competitive strength of each business unit
Step 2 is similar to Step 1, but instead of industry attractiveness, we try to find out the competitive strengths of Units A and B.
List the factors: To determine the competitive strengths of Units A and B, the following are among the factors that can be taken into consideration: market share, growth rate, profitability, brand reputation, and customer service.
Decide weights: For simplicity’s sake, let us take into account only three factors here: market share, profitability of the unit, and brand reputation.
As in the case of industry attractiveness above, we need to decide the weight of each factor—that is, how important each factor is—on a scale from 1 (not important) to 10 (very important).
Say, market share is the most important factor, so give it 5 out of 10. Give profitability 3 out of 10, and brand reputation 2 out of 10 (the weights must add up to 10).
So, this means that, in this example, market share is being considered as the most important factor in evaluating the relative strengths of the two units.
Rate the factors: Now, as above, rate each factor for each business unit on a scale of 1 (not important) to 10 (very important factor).
Let us imagine that for Unit A, brand reputation is the strongest factor, and gets 5 out of 10. Market share and profitability score 1 each for Unit A.
For Unit B, market share gets a score of 3, profitability 6, and brand reputation 1 (the ratings need not add up to 10).
Weighted score: To get the weighted score for each factor of competitive strength for each unit, we multiply the weight for the factor by the rate for the unit. Here are the weighted scores for Unit A and Unit B.
Unit A: 1. Brand reputation: 2 (weight) x 5 (rate) = 10. Market share: 5 x 1 = 5. Profitability: 3 x 1 = 3. Total weighted score = 10+ 5+ 3 = 18.
Unit B: Brand reputation: 2 x 1 = 2. Market share: 5 x 3 = 15. Profitability: 3 x 6 = 18. Total weighted score: 2 + 15 + 18 = 35.
Step 3. Determine the position of the units on the matrix
Once we have the weighted scores of the units, we can plot the units on the matrix. Here, in the example, Unit A and Unit B score 29 and 41 in industry attractiveness, and 18 and 35 in unit strength, respectively.
Each unit is represented by a circle with its size showing the unit’s market size. A pie chart can also be shown on the circle showing its market share.
Generally, unit that are above the diagonal of the matrix would be candidates for additional investments and those below candidates for divestment.
Units that fall on or about the diagonal are usually put in the “hold” category. A dimension showing the outlook for the units can also be included, and it is explained in Step 5.

Step 4. Determine the strategy option for the units
Depending on the position of the unit on the matrix and the box on the matrix in which it has been placed, three categories of investment or divestment decisions can be made: (1) invest; (2) hold; (3) harvest or divest.
Corporations are advised to make resources available to units in the “invest” category, as they promise high returns in the future. As for the “hold” category of units, corporations may invest in them only if they appear to have a future and if resources are available to the corporation after investments have been made in the units in the “invest” category.
Corporations are advised to harvest or divest units in the “harvest/divest” category” if they are not showing any promise. If these units are still generating cash, this revenue can be used to fund the promising units.
Units that are making losses and those for which a turnaround plan is not feasible should be divested.
In the example of the two units above, Unit A is in the “hold” category, and Unit B is in the “invest” category.
Step 5. Forecast the future of the units
The wisdom of business analysts is necessary to predict the outlook for any industry. For example, the matrix shows that Unit B is in the invest category.
However, if the outlook for its industry shows that the market is likely to shrink and it might lose strength, Unit B would become much less attractive for investment.
On the other hand, if the future scenario for Unit A shows that its industry is poised for growth, the unit, now placed in the “hold” category by the matrix, will become attractive for investment.
GE-McKinsey Matrix vs. BCG Matrix
The main advantage of the GE Matrix as a strategy tool is, of course, that it tries to answer the question of where scarce resources should be invested.
It is more refined than the BCG Matrix as it replaces a single factor, “market growth,” with many factors under “market attractiveness.”
Similarly, competitive strength of a business unit in the GE Matrix includes many more factors than just market share, as seen above.
But, like the BCG Matrix, the GE Matrix also fails to consider interdependencies between business units under one corporation and their core competencies.
Another disadvantage of the GE Matrix is that preparing it is a complicated exercise that probably demands the expertise of a consultant. Found this lesson useful? You’re going to love our online Mini MBA certificate course. It covers other important strategy concepts (including powerful frameworks), as well as the wider range of super-essential business topics.
Get your Mini MBA Certificate
Learn more about this most popular online course that covers economics, accounting, finance, marketing, strategy, operations and much more.
Leave a Comment Cancel reply

How it works
For Business
Join Mind Tools
Article • 11 min read
GE-McKinsey Matrix
Determining Investment Priorities
By the Mind Tools Content Team

If you had endless amounts of money and time, you probably wouldn't need to worry about how and where to allocate your resources.
But, in reality, we all have to prioritize our investments – particularly when economic conditions are tough.
When faced with this challenge in your organization, how do you decide which product groups to continue investing in, which market segments to focus on, and which business units to sell? You could just make educated guesses, but surely there's a more methodical and reliable way?
There is, and it's called the GE-McKinsey Matrix. This tool helps you to understand where to invest your resources, based on logic and robust evaluation. It provides the means to understand and objectively assess the potential of your business portfolio.
In this article, we explore what the GE-McKinsey Matrix is, what you can use it for, and how to put it into practice.
What Is the GE-McKinsey Matrix?
In the 1970s, the Boston Consulting Group (BCG) developed the Boston Matrix . The Boston Matrix uses market growth and market share as a way of screening opportunities, to help organizations to choose those that will likely give the best results. In the 2x2 Boston Matrix, the more market share and market growth your product line has, the more attractive it is – and, therefore, the more you should invest in it.
General Electric (GE) liked the visual aspect of BCG's matrix, but not the dimensions, so the company asked its consulting firm, McKinsey & Company, to create a model that better suited its needs. See the 3x3 GE-McKinsey Matrix (also called the McKinsey Matrix, the Business Strength Matrix, and the Nine-Box Matrix), shown in figure 1.
Figure 1 - The GE-McKinsey Matrix

Adapted from 'Enduring Ideas: The GE-McKinsey Nine-Box Matrix,' September 2008, McKinsey Quarterly, www.mckinsey.com . Copyright (c) 2016 McKinsey & Company.
The GE-McKinsey Matrix uses the dimensions of industry attractiveness and business unit strength. Both dimensions include a wide variety of factors – the organization itself chooses which to focus on.
The original GE-McKinsey Matrix showed industry attractiveness on the x-axis (horizontal), and business unit strength on the y-axis (vertical). Over time, it has become more common to do the opposite, which is what you see in figure 1.
Also note that the horizontal scale runs from high to low.
Most people consider the GE-McKinsey Matrix to be more sophisticated than the Boston Matrix because it has more flexibility and a wider scope. By plotting the positions of various business units, product lines, or products, a company can quickly visualize how best to allocate its resources. Many organizations find this quick summary approach effective for developing, evaluating and communicating strategic decisions.
Using the GE-McKinsey Matrix
There are three steps involved in using the Matrix:
To help you to carry out your analysis, download and print off our free template , and use it to write down answers to the following questions.
Step One: Determine Industry Attractiveness (vertical axis)
Several factors define the attractiveness of an industry, and you can use them to help to decide whether you want to enter a particular market in the first place. Here are some common examples that may or may not be appropriate for your business:
- Market growth (from the Boston Matrix).
- Market size.
- PEST factors – Political, Economic, Sociocultural, and Technological.
- Porter's Five Forces factors – supplier power, buyer power, strength of competition, threat of substitution, and barriers to entry.
- Workforce availability.
- Fluctuations/changes in demand.
- Profit margins.
- Legal and/or regulatory pressures.
Use this list as a starting point to brainstorm the factors that you'll use to determine how attractive your markets are. This is a subjective process, and different organizations will come up with different conclusions. Just be aware that you'll need to apply these factors to all of the business units or product lines that you evaluate. This helps you to compare the overall attractiveness of each unit or product that you're considering.
Assign a weight of between 0.1 and 1.0 to each factor to reflect how important it is, and ensure that they add up to 1.0. Then rate each business unit on each of your industry attractiveness factors, using a scale of 1–9:
1 = Extremely unattractive. 5 = Industry average. 9 = Extremely attractive.
Next, multiply the rating by the weight you assigned to reveal a score for each factor, for each business unit, and add these scores together for each business unit or product line.
You can see a worked example of this in action below:
Key: BU=Business Unit, R=Rating, WR=Weighted Rating
You can see in this example that BU2 has the highest industry attractiveness, followed by BU3, and finally BU1. We'll plot these scores on the Matrix in Step Three.
Step Two: Determine Business Unit Strength (horizontal axis)
The "business unit strength" dimension combines factors that determine how strong a particular business unit or product is, compared to others in its industry. It focuses on elements that your company can (largely) control.
However, do bear in mind that operating in an attractive market may not be profitable; for example, if your organization lacks the ability to supply customers effectively with what they want.
Again, you can use various factors to gage business unit strength, including:
- Market share (from the Boston Matrix).
- Production capacity.
- Production flexibility.
- Product differentiation.
- Company reputation.
- Managerial competence.
- Customer loyalty.
SWOT Analysis is a useful framework for determining and evaluating business strength.
As before, brainstorm the factors that you'll use to evaluate how strong your business unit or product market is. Remember, you'll apply all of these factors to all business units or product lines.
Once you've done this, follow the same steps as you did to determine industry attractiveness: assign a weight of between 0.1 and 1.0 to each factor, to reflect how important it is, and check that they add up to 1.0. Then rate each business unit on each business unit strength factor, using a scale of 1–9:
Multiply the rating by the weight you assigned to reveal a score for each factor, for each business unit. Finally, add these scores together for each business unit or product line.
You can see a worked example below:
In the table above, you'll notice that each business unit has been assigned a percentage against market share. This is worked out independently of the matrix, but will be used as part of the analyzes in Step Three.
Step Three: Plot the Information
Plot your business units, or product groups, onto your matrix (see the example in figure 2). Use a circle for each business unit, following these guidelines:
- Business unit strength and industry attractiveness are shown by the circle's position on the matrix.
- Market size is represented by the size of the circle.
- Market share is represented by a pie chart within the circle.
Figure 2 - Example of a Completed GE-McKinsey Matrix

Sometimes a Matrix includes arrows leading from the circles. These arrows indicate the direction in which you expect the business unit to move, relative to competitors and the industry as a whole.
Interpreting the GE-McKinsey Matrix
The resulting matrix is easy to read, and it clearly identifies the strategic position of each of your business units or product lines. Essentially, you're looking for business units or product lines to be positioned as far to the left and as high up as possible (remember that the horizontal scale runs from high to low).
The Matrix outlines a set of strategies related to the positions of the business units:
- Grow: Strategic Business Units (SBUs) in the top left corner (dark blue squares) have a relatively strong position in an attractive industry. This indicates that it's a good idea to invest in these. Look for growth opportunities, and build on current strengths to improve your position in the market.
- Hold: SBUs in the middle (light blue squares) are average. Some might have a good position in a slower industry, or they might have a weak position in a good market, but there's something positive that you can develop within these business units. You could consider investing more resources, defending your current position, or attempting to find a niche, for example.
- Harvest/Exit: SBUs in the bottom right corner (lightest blue squares) are in an unattractive industry, a weak position, or both. There are no promising scenarios, so it's probably best to look at exit strategies. It would be unwise to invest any further in these business units, and it would make more sense to reallocate resources to units in other parts of your Matrix.
The Matrix provides a great visual summary of relative positions, and it's a good starting point for investigating the strategic direction that best fits each business unit or product line. However, it's important to remember that many other criteria may also be relevant when you analyze a business unit – not just the ones in the GE-McKinsey Matrix.
We have a range of resources on Strategic Prioritization in our Strategy toolkit area, to help you when making business decisions.
You can use the GE-McKinsey Matrix to consider where to invest resources in various parts of your organization. By analyzing a business unit based on its market strength and the attractiveness of its industry, you can quickly see how well positioned it is for growth and potential.
The Matrix can give you an excellent overview of your strategic business units, or other segments of your company. From there, you can start a detailed investigation of the exact strategy to pursue – so that you maximize your market position, and best allocate your resources.
Download Template
You've accessed 1 of your 2 free resources.
Get unlimited access
Discover more content
The pricing strategy matrix.
Selling Your Product or Service at the Ideal Price
McKinsey's Seven Degrees of Freedom for Growth
Exploring New Opportunities for Success
Add comment
Comments (0)
Be the first to comment!

Get 30% off your first year of Mind Tools
Great teams begin with empowered leaders. Our tools and resources offer the support to let you flourish into leadership. Join today!
Sign-up to our newsletter
Subscribing to the Mind Tools newsletter will keep you up-to-date with our latest updates and newest resources.
Subscribe now
Business Skills
Personal Development
Leadership and Management
Member Extras
Most Popular
Newest Releases

What Is Stakeholder Management?

Mind Tools Store
About Mind Tools Content
Discover something new today
Business reports.
Using the Right Format for Sharing Information
Making the Right Career Move
Choosing the Role That's Best for You
How Emotionally Intelligent Are You?
Boosting Your People Skills
Self-Assessment
What's Your Leadership Style?
Learn About the Strengths and Weaknesses of the Way You Like to Lead
Recommended for you
How big things get done.
With Dan Gardner
Expert Interviews
Business Operations and Process Management
Strategy Tools
Customer Service
Business Ethics and Values
Handling Information and Data
Project Management
Knowledge Management
Self-Development and Goal Setting
Time Management
Presentation Skills
Learning Skills
Career Skills
Communication Skills
Negotiation, Persuasion and Influence
Working With Others
Difficult Conversations
Creativity Tools
Self-Management
Work-Life Balance
Stress Management and Wellbeing
Coaching and Mentoring
Change Management
Team Management
Managing Conflict
Delegation and Empowerment
Performance Management
Leadership Skills
Developing Your Team
Talent Management
Problem Solving
Decision Making
Member Podcast

Guide to the GE McKinsey matrix for analysis
Reading time: about 6 min
A well-balanced portfolio of products is vital to your company’s growth and success, but deciding which products to include can be daunting. Fortunately, the GE McKinsey matrix can help you determine which products your customers are interested in—these are the ones that deserve time and resources.
In this article, we’ll discuss the GE McKinsey matrix, where it came from, its components, and how it can help you develop a product portfolio that will meet customer needs.
What is the GE McKinsey matrix?
The GE McKinsey matrix, or the GE-McKinsey nine-box matrix, is a strategic framework that lets you evaluate your company’s products, services, and strategic business units. When you know which products and services are most important to your company's growth, you better understand where to focus resources and time in your development efforts.
Where did the GE McKinsey matrix come from?
The GE McKinsey matrix was developed in 1970 when General Electric (GE) asked the management consulting firm McKinsey & Company for help managing its business unit portfolio.
What are the main uses of the GE McKinsey matrix?
The GE matrix is a versatile strategic planning tool to help you make better decisions concerning your company’s business units and product development. Specifically, the GE McKinsey matrix can help you:
- Analyze and prioritize your business portfolio : Use the 3x3 GE model to determine which markets might be best for your products.
- Allocate resources : The matrix can help you not only to determine where you need more resources, so you can easily reallocate to projects with higher priority.
- Strategically plan for the future : The GE McKinsey matrix can give you insight into each business unit or product's direction. This can help you make better decisions about future development within each market.
- Develop a balanced portfolio : The GE matrix encourages you to prioritize high-growth and stable components to optimize the portfolio.
- Assess potential risks : The matrix can help you assess potential risks. For example, products placed in the lower right grid box might be at higher risk because the market is unattractive and competitive strength is low.
- Align departments and teams : The GE McKinsey matrix is a visual tool that makes it easier to communicate priorities and decisions across your organization. This helps keep everybody on the same page and discourages siloed work.
Understanding market attractiveness and competitive strength
Market attractiveness and competitive strength are the two dimensions used by the GE McKinsey matrix for product analysis and evaluation.
The market attractiveness dimension is on the vertical axis to the left of the 3x3 grid. It is used to look at external factors such as market size and growth rate that might positively or negatively impact your business offerings. Each row in market attractiveness is labeled “High,” “Medium,” and “Low.” Items in the “High” section are the most likely to be profitable.
The competitive strength dimension is placed on the horizontal axis below the grid. It evaluates internal factors such as current market share, production capabilities, etc. The columns in competitive strength are labeled “High,” ‘Medium,” and “Low.” Each item in the “High” section has the potential to capture a significant market share.
Strategic implications and decision-making for managers
Each product, service, or business unit is placed into a section of the 3x3 matrix that corresponds to one of the three categories listed below. Placing components in the proper location will help you to make strategic business decisions.
- Growth strategy : Items placed in the three boxes in the upper left corner of the grid have justification for increasing budgets and resources for development, marketing, and growth so that you can increase or maintain market position.
- Hold strategy : Products and services placed in this section, which runs diagonally from the lower left corner to the upper right corner, provide average performance in an average market. There might be a chance for growth and improvement, but you shouldn’t allocate more money and resources for now.
- Harvest strategy : Products and business units in the lower left corner are in an unattractive market or perform poorly. If these components make money, you might consider investing the excess cash into other segments.
How to use the GE McKinsey matrix
GE McKinsey matrices are quite simple to set up. Just follow the steps below, or use Lucidspark’s free template to get a head start on your work.

Step 1: Determine the market attractiveness and competitive strength for each product or business unit you want to evaluate
Collect data for each product or business unit. Include external factors like market size, growth rate or potential for growth, current competition, market share, brand strength, etc. Also include internal factors such as current market share, product technology and innovation, current capacity and capability, etc.
Step 2: Plot the information on the matrix
Each row and column in the McKinsey matrix is labeled “High,” “Medium,” and “Low.” Place the item with the highest market attractiveness/highest competitive strength in the “High”/”High” box, usually in the upper left corner of the matrix. Place your lowest market/weakest competitive item in the “Low”/”Low” box, usually in the lower right corner of the matrix.
Use the information you gathered to rate each item so you can place it in the appropriate grid box. For example, you might have items corresponding to “High”/”Low,” “Medium”/”High,” etc.
Step 3: Determine where to invest and what actions to take
Plotting your matrix gives you a visual representation of your product or business unit prioritizations and helps you know what action to take.
- Invest in the items in the growth strategy category. Keep these products and business units healthy in their respective markets with continuous improvement and innovation to meet customer needs.
- Decide whether to improve, hold, or divest items in the hold strategy category.
- If products or business units are performing poorly, you may want to liquidate. Or, if these items bring in surplus cash, you might want to invest just enough to keep them going as long as you don’t invest more than you bring in.
Step 4: Create a plan and allocate resources
After you’ve determined what to do with each item in the matrix, you’ll need a plan to implement your strategies for each item. Your plan should include a budget, human resources, materials, and equipment needed to complete the work.
For example, you might need to determine if you’ll hire new people, bring in temporary contractors, or move existing people and equipment around. How much will it cost to bring in new people and new equipment? How much money is needed to market your products and brand?

Learn more about other types of prioritization matrices to decide which is best for your team.
About Lucidspark
Lucidspark, a cloud-based virtual whiteboard, is a core component of Lucid Software's Visual Collaboration Suite. This cutting-edge digital canvas brings teams together to brainstorm, collaborate, and consolidate collective thinking into actionable next steps—all in real time. Lucid is proud to serve top businesses around the world, including customers such as Google, GE, and NBC Universal, and 99% of the Fortune 500. Lucid partners with industry leaders, including Google, Atlassian, and Microsoft. Since its founding, Lucid has received numerous awards for its products, business, and workplace culture. For more information, visit lucidspark.com.
Related articles

Learn how to use Dynamic Matrix—a powerful way to organize brainstormed ideas, plan your work visually, and take actionable steps. Includes free course!

In this post, we’ll discuss the BCG matrix and how you can use it to make informed decisions about your company’s product portfolio.
Bring your bright ideas to life.
or continue with
- What is the market penetration strategy?
- In-depth analysis of usance of GE-McKinsey Matrix
- Recapitulation of Strategic planning models
Table of Content
- What is the GE McKinsey Matrix?
- Importance of GE McKinsey Matrix
- Application of GE McKinsey Matrix
- Illustration of application of GE McKinsey Matrix
GE McKinsey Matrix
General Electric Matrix was given by McKinsey in 1970 to manage a large and complex portfolio of strategic business units. This model was developed when General Electric engaged McKinsey and Company to help companies take strategic decisions at the corporate level. The strategic planning tool helps the organization to prioritize its investment in different business units by considering three possible scenarios which include protect, harvest, and divest. It consists of the Nine-cell Matrix that considers the industry attractiveness as well as business strengths while proposing and guiding various business strategies. You also need to consider that it is one of the good alternatives to the BCG Matrix as the two factors i.e. industry attractiveness and business strengths considered in this Matrix consist of various multiple factors which help to make the best decisions.
The need for the GE McKinsey Matrix
GE-McKinsey Nine-box Matrix helps to take the best strategic decisions by considering various strategic options available to the organization to get maximum from its business units. The use of this Matrix also helps to evaluate various types of the business portfolio and make the best decision. This model also helps to maximize results with little effort and prioritize various investment decisions in a systematic manner. The industry attractiveness is measured on the basis of the market size, market profitability, pricing Trends, risks, market segmentation, opportunities to differentiate the products and services, entry and exit barriers, long-term growth potential, bargaining power of the suppliers and buyers in the industry, etc. The competitive strength in the industry is also evaluated on the basis of a number of factors which include market share, market growth potential, brand awareness, customer loyalty, product uniqueness, profit margins of the business, relative cost position, technological advancement, distribution strength, etc. Thus, the organizations can use this Matrix in place of the BCG Matrix as it involves better judgment of the strategic decision making as much more information is used in this Matrix when compared to the BCG Matrix which also helps to establish a strong competitive position of the business in Industry.
How to apply the GE McKinsey Matrix?
GE-McKinsey Nine-box Matrix can be used by considering the industry attractiveness and strengths of the product and business unit. The industry attractiveness can be determined by considering the industry size, profitability, environmental factors, pricing and labor requirements, etc. The industry attractiveness is plotted on the vertical axis which includes measures of industry attractiveness as high, medium, and low. The higher industry attractiveness represents higher profitability which then encourages the other firms to enter the industry.

After considering the industry attractiveness, the competitive strength of the product and business unit is evaluated by analyzing the market share, average profitability, strength of the brand, customer loyalty, etc. This segment is plotted on the horizontal axis of this Matrix which is also segmented into three categories i.e. high, medium, and low.
After evaluating industry attractiveness and competitive strength, each strategic business unit is placed in the matrix which then helps to determine the strategic possibilities for each SBUs. The diagonal line can also be drawn from corner to corner from low strength to high industry attractiveness. The organization can invest more in the SBUs above the diagonal line whereas the organization can divest from or provide lower funding to SBUs that are below the diagonal line. Thus, the organization can increase or decrease the investment on the basis of the position of each strategic business unit.
GE-McKinsey Matrix real example
Probing further, let us highlight the Apple GE-McKinsey Matrix for practical understanding. The different product lines of Apple include iTunes, iPod, iPad, iPhones, laptops, desktops, and iMac.
To prepare this Matrix, we first need to consider the industry attractiveness for different strategic business units. The industry attractiveness for smartphones and iPad is very high due to increasing demand for these products, lower bargaining power of the customers, higher profitability, product differentiation, etc. Different features such as long-lasting batteries, high-speed processors, large screens, etc. are also influencing the demand of tablets and smartphones. However, the industry attractiveness for iMac, iTunes, and iPod is generally medium as there is a lack of product differentiation in regard to these products and the number of competitors in the market for laptops, online music streaming apps, etc. is rising. The global laptop market is also growing only at the CAGR rate of 0.4% as increasing sales of smartphones are restraining the growth of the laptop market.
Now, let us consider the company strengths to position each strategic business unit and product in the GE McKinsey Matrix. Apple has achieved a leading position in the smartphone market due to higher product innovation and uniqueness. Apple iPhone 12 also has been recognized as the world’s bestselling 5G smartphone due to mmWave support features, premium product features, etc. The Apple iPad also dominates the global tablet market and has grabbed 37 % market share in the first quarter of 2021. The impressive sales boost of Apple iPad is the result of the remote working conditions and uniqueness of the product.
We all know that the demand for laptops is also rising in the current times but the presence of a large number of competitor firms has resulted in wider choices being available to the customers. iMAC enjoys medium competitive strength in the market as, despite recent developments and innovations, Mac market share accounts for only 8.5 % in the industry. However, Apple iTunes and iPods enjoy a strong competitive advantage in the market as iTunes and the iPod revolutionized the whole music industry, and around 72 million individuals subscribed to Apple Music by the end of June 2020.
On the basis of the above analysis, the GE McKinsey Matrix for Apple is prepared as follows-

Now, the organization can also engage in strategic planning considering the position of each line of the product to invest in the most profitable areas. The company should invest in IPad, iPhones, Apple iTunes, and iPods as all these products fall in the growth investment area. The higher growth potential of the organization also helps to ensure higher returns of the organization which also supports that Apple should invest in all these product areas. However, Apple needs to hold the iMac product line as the position of this business unit is ambiguous and the future growth of this product is unclear. The company also needs to increase sales of iMac by improving customer loyalty, increasing investment in advertisements, etc. Hence, the use of this strategic model can help the organization to consider the current position of its strategic business unit and plan future growth strategies.
How to use BCG Matrix for strategic planning
A intensive study of bowman's strategy clock.
BUS501: Strategic Management
The ge approach.
Read this article on the GE/McKinsey matrix model. Strategic planning is a system that allows managers to make decisions regarding processes or choices they need to make on behalf of the organization. The planning process helps leaders organize their reasoning behind specific objectives by mapping out the process for implementation.
The GE / McKinsey matrix is a model used to assess the strength of a strategic business unit (SBU) of a corporation.
LEARNING OBJECTIVE
Review the definition of the GE Approach and its uses
- The GE matrix analyzes market attractiveness and competitive strength to determine the overall strength of an SBU.
- External factors of market attractiveness that affect a business include market size, market growth, entry barriers, segmentation, and overall risk.
- Internal factors of competitive strength include assets, competencies, brand strength, profit margins, innovation, and quality.
- The GE matrix can also be used to determine if an organization should enter a market or if it should reposition a product line or brand within a market.
A mid-sized business or a division of a corporation that has different strategies and objectives than its parent company.
GE Approach to Strategic Planning
The GE / McKinsey matrix is a model used to assess the strength of a strategic business unit (SBU) of a corporation. It analyzes market attractiveness and competitive strength to determine the overall strength of an SBU.
The GE Matrix is plotted in a two-dimensional, 3 x 3 grid. The Y-axis measures market attractiveness based on a high, medium, or low score. The X-axis measures business unit strength on a high, medium, or low score.

GE/McKinsey Matrix - The matrix shows market attractiveness and business strength.
Market Attractiveness
Market attractiveness deals with different external factors. These factors can include such things as market size, market growth rate, and market profitability. External factors that can affect market attractiveness also include pricing trends, competitive intensity, overall risk, and entry barriers. Other considerations regarding market attractiveness include what if any opportunities there are to differentiate products and services, demand variability, segmentation, distribution structure, and technology development.
Competitive Strength
Competitive strength focuses on internal factors and the ability of the SBU to overcome specific issues with the market and competitors. Different internal factors that need to be considered include assets and competencies, brand strength, market share, market share growth, and customer loyalty. Other factors that should be considered include relative cost position, profit margins, innovation, quality, financial resources, and management strength.
Uses for a GE Matrix
While the GE / McKinsey matrix was originally used to assess an SBU, corporations can use this for other purposes as well. It is a good way to determine if a company should enter a specific market. It is also a good way to assess how a company is doing in a specific market and if repositioning may be necessary to revive a faltering product line, brand, or organization.


The Only Course You'll Need To Understand Marketing Like Never Before
How to Get Started with Marketing and Design Your Career in 5 Steps

GE Matrix for Product Portfolio Analysis A marketer in today's time works on massive product portfolios. In this scenario, the GE matrix serves as a great framework to analyse the various products. Here's my take on the framework.

GE Matrix or McKinsey Matrix or GE-McKinsey Matrix. All of them are the names of this strategy tool that helps you analyze your product portfolio.
“Between calculated risk and reckless decision making lies the line between profit and loss”
The GE Matrix fits perfectly in the analysis of the product portfolios of a company.
For a company earning profits from just one source or one product is risky. Therefore, new product development or diversification is the only way out.
On that note, just consider a massive giant like Unilever. You will be astonished to see the diversification in their product portfolio. Have a look!

Source: World's leading Companies
To simultaneously keep a check on these diverse brands and take decisions according to their performance, it is imperative to use a systematic framework like a GE Matrix.
As I write this piece in October 2018, I am working on a consulting assignment in Singapore for one of the top American pharmaceutical companies.
They have a large product portfolio spanning across various therapeutic specialties.
My interaction with the marketing managers and the sales team led me to the understanding that the government ordering of medicines happens through tenders.
One of their high performing products (by sales) does good numbers only when it bags the government tender for that year. Otherwise, for the private market, it sells like a commodity with a lot of competition and generic drugs eating into their market.
The assignment that I have includes working on this product and making it a strong part of the portfolio. The objective is to make it do well in the private market as well.
For them, the idea is to move away from the instability that this product brings to their balance sheet every other year when they win or lose the government tender.
And that makes perfect sense as per the portfolio effect. You tend to diversify or spread your risks across products and business units.
The GE Matrix helps you identify the performance of the products in your product portfolio.
What Exactly is the GE Matrix?
The GE matrix is a 9-box matrix which helps corporations to evaluate their business portfolios and prioritize investments among their diversified units in a systematic manner.
You would have heard about the Boston Consulting Group Matrix popularly known as the BCG matrix. GE Matrix is an extension and an improved version of it.
In case you need a thorough understanding of the BCG Matrix, here are a few examples from some of our blogs:
Also Read: The BCG Matrix – What is it and how to use it
The businesses now are becoming more and more vulnerable and dynamic.
They are more focused on their investment which gives maximum results, this matrix ensures the company to analyse in a more systematic and precise manner.

Rather than relying on future projections of business unit, the company can make a systematic decision taking two factors into consideration: the attractiveness of the relevant industry and the competitive strength of the unit within its industry.
The GE matrix is of 3X3, where Y-axis measures the attractiveness of the market and X-axis measures the strength of the business unit.
If you are wondering how to go about classifying products in these two categories, lets have a look at the two terms in detail.
Market attractiveness
Market attractiveness talks about the perks the potential market holds for the company. Therefore, before diversification, a company has to check certain components of the market. These include the following:
a) Size of the market
b) Structure of the industry
c) Competitors
d) Entry and exit barriers
e) Product life cycle
Example for Market Attractiveness
To understand this better, we’ll consider the market attractiveness component for Reliance Retail from GE Matrix of Reliance.
Reliance Group, led by Dhirubhai Ambani, started back in 1966 and was mainly functioning in the infrastructure, power and communications sector. In 2006, the company took a when they started Reliance Fresh.
Now, why is it that from selling electricity and gadgets Reliance directly came down to selling potatoes and tomatoes?
Are these decisions taken by marketers just out of the blue?
Well, a study of 33 markets across the country has analysed that the retailers of the vegetables and dairy items are selling at a profit of 48.8% than the wholesale prices.
India is one of the top 5 retail markets in the world and retail trade holds about 10% of our GDP .
Reliance Fresh, which now has about 700 outlets in the 93 cities, has been tapping the potential retail market of the country.
It even plans to invest 3.5 billion dollars in the coming years to optimize their operations.
Business strength
Every business has to run along with its competitors. Along with that, it needs to capitalize on its core competencies to create a sustainable advantage.
Internal as well as external factors help the company to define their position in a competitive setup.
Internal factors – product differentiation, the company’s market share, assets, R & D services, customer loyalty programmes etc.
External factors – Competitors, Government regulations, the economic condition of the market, external parts of the value chain.
Example for Business Strength
How many of us remember Foodle?
For the many who may not remember, it was a brand extension of Horlicks, back in 2010.
The company launched the product with an idea of making a healthy alternative to Maggi noodles.But despite aggressive marketing and promotions, the brand still couldn’t gather a considerable market share.

It faced a tough competition from the already existing brand – Maggi, more specifically from Maggi Atta noodles. How often would companies be able to survive when the market is dominated by certain brands already.
As it turned out, It was not only an unsuccessful brand extension but it also hampered the profitability of Horlicks.
What can we Infer from the GE Matrix?
As you could see from the GE matrix given in the image above, you would identify and label each product and the business unit which you are evaluating.
In GE Matrix these labels are Growth, Selectivity,and Harvest, Below, I would explain each of these labels and what does it mean for the company that falls under that category.
Also Read: Important Frameworks for Marketers
Growth in ge matrix.
As the name suggests, the business units that fall in this category are products which will be giving higher returns in the near future.
So the investments required here are more in R & D, promotions, advertisements etc.
Selectivity in GE Matrix
It is quite similar to the question mark product of the BCG matrix , wherein the state of the product is still in ambiguity. However as uncertainty prevails and as business units are always going to be risky, the final decision is made by the management which is in line with their vision.
Harvest in GE Matrix
This category is similar to the dog products of the BCG matrix . Herein, the products are not going to reap the desired profits and are likely to fail.
Investing in such products will be an in-elevation risk for any organization.
Each box in the GE Matrix can be attributed a particular decision that can be taken by the parent company.

How to Build a GE-Mckinsey Matrix?
The GE matrix for any company can be developed by following these simple steps:
Step1: Determine Market attractiveness of each of the business units
In order to determine the industry attractiveness, first shortlist the factors that will determine the attractiveness of the Industry. We have discussed them in this blog, so you can refer some of those factors.
After you have decided the factors, rate each factor based on its importance in determining the industry attractiveness. For example, if market share is one of the factors and you consider it to be the most important factor, give it maximum weightage of let’s say 30%.
Give each of your product a score out of 10 based on the factors that you have listed.
Calculate the weighted average by considering both the weightage of the factor itself and the score given to each business unit.
Step2: Determine Competitive Strength of each of the business units
Again, follow a similar methodology of making a list of factors and then assigning them weightage according to their importance.
Rate all business units out of 10 on these factors and then calculate a weighted score.
Step3: Analyse the information and Place them on the GE Matrix
According to the weighted scores of each business unit in terms of market attractiveness and competitive strength, plot them on the matrix.
Step4: Take decisions accordingly
Prioritise your further course of action based on the location of business unit on the GE matrix.
If you found this confusing, I have you covered because we’ll now be performing all these steps with GE Matrix example.
GE Matrix of Reliance
I thought it would make more sense if analysed GE Matrix with Indian Example. So, lets consider one of the most influential Indian firms for our GE Matrix example- Reliance.
Reliance Product portfolio includes its services in the Petroleum and Natural Gas sector, Petrochemicals, Textiles, Retail, Telecommunication, Entertainment, Financial Services and software.
For our analysis, let’s select a group of 5 business units from these sectors that Reliance operates in:
Jio Communication
Reliance Fresh
Step1: Analysing the Market Attractiveness

(Data used may not be accurate. Used just for calculation example purposes)
Step2: Analysis of Competitive Strength

Step3: Plot the Matrix

Step4: Conclusion from the GE Matrix
As per the GE Matrix, all 5 business units fall in the category of Invest and grow. The company should be focussing on all these businesses in the coming years as per our conclusion.
As every tool or framework has its pros of being a great aid in the decision-making process, it has its limitations as well.
While the GE Matrix helps a marketer in taking product portfolio investment decisions, it has its limitations too!
One of those limitations is that the potential synergy and the undercurrents between two business units of the similar organisations are not considered.
Which means that at times certain businesses are run or certain products are maintained because they help in accentuating the other business or product. And therefore, killing this product or thinking of the other product to be the strong product is misleading.
Despite, those small nuances, the GE matrix is still one of the best management tools for the marketers.
You May Also Like

What can Tai Lopez teach you about Marketing? You may know Tai Lopez as the social media guy who features in your Facebook timeline quite often. His social media game is strong. But in this article, I will not share with you the Tai Lopez social media marketing strategy. In fact, I will share with you the 5 things you as a marketer can learn from Tai, in general.

How to market and sell condoms or anything taboo We all have shied away from watching those condom commercials on the television. Most of us skip those ads. And if we are skipping them, who is really watching them? Is there something more that the best condom brands need to do in their marketing. In this article I explain to you how you can market any taboo product.

“This Airline is So Going to Shut Down!” – A Strategy Faux Pas In this article, I take the example of an airline's poor execution of its strategy and what it tells about the importance of strategy implementation. Further, I talk about the reason why strategy implementation is tougher than strategy formulation.

Zoho Corporation – the best Marketing Strategy example? [Case Study] A good marketing strategy is one which integrates with the people, systems, culture and the structure of the organisation. Here, I share with you my study of what makes the Zoho Marketing Strategy, probably the best marketing strategy that I saw in the field of CRMs.

How to do insightful Secondary Market Research?

Learn Value Ladder Model for Business Plans [with Examples] Get answers to all your questions to what a value ladder model is and what is the process to create one. Learn interactively through examples.
About the Author: Darpan Saxena
The GE-McKinsey Matrix: a business portfolio analysis and strategic decision-making tool

GE-McKinsey matrix
The GE-McKinsey Matrix, or attractiveness/strength matrix, is a strategic decision-making tool that facilitates the management of a portfolio of activities within a company. This model makes it possible to analyze each of its strategic business units (SBUs) along two dimensions: their competitive strengths and market attractiveness. The position obtained by a business unit on the matrix gives rise to specific strategic recommendations and facilitates the allocation of resources.
What is the GE-McKinsey Matrix?
Developed in the 1970s by the McKinsey consulting firm, the attractiveness/strength matrix is a decision-making assistance tool. Completed as a team, this modeling makes it possible to analyze the company’s portfolio of activities and formulate recommendations adapted to each strategic business unit.
A strategic business unit , or SBU, refers to a homogeneous segmentation of the company according to its different activities and the markets in which it operates. An SBU is understood to be able to operate as an autonomous entity. The activities grouped together within a single SBU operate in the same markets, face the same competitors, and share similar technologies. A large company generally groups its activities into SBUs to facilitate its organization, decision-making, and resource allocation.
Putting the various activities of your portfolio in a matrix may seem trivial. However, it is a real strategic issue. The reflection carried out during the creation of a GE-McKinsey Matrix is profound; each activity must be evaluated along two lines:
- The market attractiveness , which corresponds to an external analysis ;
- The competitive strengths of the SBUs, which correspond to an internal analysis .
These dimensions are based on a multi-criteria approach, which makes this method a precision tool. In concrete terms, the matrix is composed of nine boxes divided into three zones associated with specific strategies, such as invest and grow, hold and protect, harvest and divest.

The position occupied by the SBU on the matrix leads to the formulation of strategic recommendations to guide the company’s stakeholders in their decision-making. The strategies can be to invest, hold a position, or divest.
The aim is to obtain an overall view of the portfolio’s activities and to increase the effectiveness of the allocation and transfer of financial, human, and material resources. The analysis also highlights promising activities for the future, and those that may threaten the company’s sustainability.
Why create your GE-McKinsey Matrix on Board?

With a few clicks, you can gather your team in Board . This digital whiteboard makes it easy for everyone to share their ideas to foster collaboration, both in the room and remotely, thanks to the built-in video conferencing tool.
By involving people from the company with diverse skills, you benefit from different perspectives and a more holistic view of the company’s business. Your analysis will, therefore, be more accurate by soliciting the collective intelligence of as many people as possible within your team. This is especially true since the choice of analysis criteria and their evaluation are highly subjective.
In addition, to help you with your external and internal diagnoses, you can use three complementary models to the GE-McKinsey Matrix, all of which are available in the Klaxoon library:
- The SWOT method allows you to analyze the company’s strengths and weaknesses, as well as the market’s opportunities and threats.
- The PESTEL analysis provides a comprehensive view of your company’s environment.
- Porter’s forces hexagon helps you analyze the forces affecting your SBUs.
And to give each participant time to reflect and optimize team members’ work time, each participant can complete the analysis grid asynchronously . Once this first step has been completed, all you have to do is meet again at the same time to discuss and place your SBUs in the matrix as a team.
How to fill out and analyze your Strength/Attractiveness Matrix in 3 steps with Board
1. analyze your different sbus using external and internal diagnostics.
This first step is undoubtedly the most complex. First, you need to identify the strategic business units (SBUs) within your company. To do this, you must understand that an SBU is a subset of activities that depend on the same criteria in a specific market. These criteria include key success factors, resources, competition, customers, etc. A concrete example: a fire safety company distributing fire protection systems, maintaining the installed equipment, and providing training in fire prevention would be likely to have identified three SBUs (trading, maintenance, and training).
In the Klaxoon template’s analysis grid, enter your company’s strategic business units in the form of ideas (these are Klaxoon’s colored thumbnails, which you can move around the Board). They have customizable fields that allow you to provide additional information. Here you may find it useful to indicate the market share that the SBU represents.
The external diagnosis determines the attractiveness of the market for each SBU
List the external factors that influence each SBU, limiting this list to the most important criteria (preferably 3 to 7). Then, using the Rating Question , each person judges the attractiveness of the market for each strategic business unit, giving it 1 to 5 stars:
- 1 to 2 stars, the attractiveness of the market is low to medium;
- 3 stars, the attractiveness of the market is medium;
- 4 to 5 stars, the attractiveness of the market is medium to high.
This way, everyone can freely express their own point of view and the overall result is instantly consolidated!

The internal diagnosis determines the competitive strengths of each SBU
Next, look at the internal factors that play a role in the competitiveness of each SBU. In other words, list the key success factors that need to be mastered in the market to be competitive. Then, everyone gives a heart (with the like button) to the key success factors that the company has mastered. According to the degree of mastery of these key success factors compared to the competition, evaluate the competitive strength of each SBU with the Rating Question :
- 1 star: the competitive position of the SBU is marginal. It has major weaknesses;
- 2 stars: the competitive position of the SBU is poor. It requires a better mastery of the key success factors to be able to compete in the market;
- 3 stars: the competitive position of the SBU is good. It has interesting strengths to support certain strategies;
- 4 stars: the competitive position of the SBU is strong. It can be the focus of a bold strategy;
- 5 stars: the competitive position of the SBU is dominant. It has the ability to shape the behavior of the competitors.
2. Place your strategic business units in the matrix
Taking into account the respective market shares of your SBU, select the appropriate pie charts provided in the template to simplify your task. Simply specify the name of the SBU and assign a color to make the matrix easier to read. And to signify the size of the market, just make it bigger or smaller.
Based on the results of your assessment of the external factors, you have determined a low, medium, or high market attractiveness for each SBU. Then, place them in the corresponding area of the matrix, along the market attractiveness axis .
Once this is done, adjust the position of the SBUs along the competitive strengths axis, based on the results of your assessment of the internal factors.
3. Develop appropriate strategic directions
The position of each SBU allows the company’s stakeholders to develop appropriate strategic recommendations . On the matrix, the gray diagonal corresponds to the three strategies for maintaining and making the SBUs profitable.
The three strategies above this diagonal are aimed at strengthening and growing an SBU. Below this diagonal, the situation of an SBU is of little interest. The three strategies there are related to partial harvesting or even divestment.
From your initial goals, set the desired positions for your SBUs taking into account the changing factors. For each strategic business unit, indicate the desired future position with an arrow, and then explain the overall strategy.
Thanks to Board, your analysis is more visual and is a team effort!
.png "ge mckinsey matrix case study")
You too can adopt Klaxoon!
With Templates, innovate in the management of your projects, represent them visually and move forward as a team in a synchronized manner
Get inspired by other templates from the same categories

Transformation map: a visual strategic change management mapping tool
As a team, list all the actions required to reach your key strategic goal.

The GROW model of coaching: definition and template
As a manager, use the GROW coaching model to increase team member engagement and help them achieve their goals.

Porter's 5 Forces: a visual model for easy competitive analysis
At the core of strategic thinking, this method helps to identify an organization's competitive advantages within its market, and create an appropriate strategy.
Unlock your teamwork potential
How to use GE matrix in strategic management?
7 minutes read
What is the GE-McKinsey Matrix?
The GE-McKinsey Matrix is a strategic planning tool that assists businesses in making investment decisions and managing a diverse product portfolio. It's a nine-cell grid that plots a company's "business unit strength" against the "industry attractiveness". In simpler terms, the business unit strength refers to how well a specific business or product line of your company is performing in comparison to competitors. This could be measured by factors like market share, brand recognition, or operational efficiency.
On the other hand, industry attractiveness gauges the overall appeal of the market where your business operates. Factors such as growth rate, profitability, barriers to entry, and technological development can influence this.
When you plot your business units on this matrix, it helps you determine where to invest, disinvest or maintain your current level of investment. It's a powerful tool for strategic management because it provides a visual representation of where your resources might be best allocated to maximize returns.

What is the GE-McKinsey Matrix used for?
Here are the key uses of the GE-McKinsey Matrix.
Strategic Portfolio Analysis
The GE-McKinsey Matrix serves as a framework for performing a strategic portfolio analysis. It allows companies to assess their different business units or product lines based on two critical dimensions - Market Attractiveness and Business Unit Strength.
Resource Allocation
The matrix aids in resource allocation decisions. By understanding the positioning of each business unit, companies can make informed decisions about where to allocate resources. Business units that lie in the high market attractiveness and high business strength quadrant are often prioritized.
Investment Decisions
Another important application of the GE-McKinsey Matrix is guiding investment decisions. The matrix provides insights on which business units warrant further investment, which ones should be maintained, and which ones could potentially be divested.
Risk Management
The GE-McKinsey Matrix can also support risk management efforts. By highlighting the relative strengths and weaknesses of different business units and their respective market attractiveness, it helps companies spread their risks across a diversified portfolio.
The GE-McKinsey Matrix is a practical tool used in strategic planning to analyze a company's portfolio, make informed investment and resource allocation decisions, and manage risks effectively. However, the successful application of this matrix requires accurate data and objective assessment.

Utilizing the GE Matrix in Strategic Management
Step 1: identify and understand the factors.
The first step involves identifying and understanding the factors under the two main dimensions:
Business Unit Strength: Several factors determine business unit strength. These could include market share, brand equity, profitability, product quality, manufacturing capability, and management caliber, among others.
Market Attractiveness: This refers to factors such as the size of the market, the growth potential, competitive dynamics, profitability prospects, and technological evolution.
Step 2: Rate Your Business Units
Rate each of your company's business units or products on a scale of 1-10 (or any other appropriate scale) for each of the identified factors. One represents weak performance, while ten signifies strong performance.
Step 3: Weight the Factors
Assign a relative weight to each factor based on its importance in achieving your company's objectives. The weights should sum up to 1 (or 100% if using percentage).
Step 4: Calculate Scores for Each Business Unit
Multiply each factor’s rating by its weight to get the weighted score. Then sum up the weighted scores to get an overall score for each business unit on both dimensions: Market Attractiveness and Business Unit Strength.
Step 5: Plot Your Business Units on the Matrix
Plot your business units on the 3x3 grid of the GE-McKinsey Matrix using their overall scores. The horizontal axis shows business unit strength, and the vertical axis shows market attractiveness.
Step 6: Determine Strategic Actions
Each cell on the grid indicates a different strategic direction:
High Attractiveness/High Strength (top right cells): Business units in these cells are strong in attractive markets. Consider investing in these units to support their continued success and market leadership.
Medium Attractiveness/Medium Strength (middle cells): Units in these cells are moderate performers. Maintain select investments to sustain their market position, with an eye for potential growth opportunities.
Low Attractiveness/Low Strength (bottom left cells): These units are weak in less attractive markets. Unless they hold some strategic importance, consider divesting or discontinuing these units.
The GE Matrix in Strategic Management: Pros and Cons
The GE-McKinsey Matrix is a popular tool for strategic portfolio management, allowing businesses to plot their different units or products based on market attractiveness and business strength. Like any strategic tool, it has its advantages and limitations.
Pros of the GE-McKinsey Matrix
Comprehensive Analysis: The matrix provides a more detailed analysis compared to similar tools, considering multiple factors under business unit strength and market attractiveness.
Informed Decision-Making: By plotting business units on the matrix, companies get a visual representation of where they stand. This can guide decisions on where to invest, maintain or divest.
Risk Diversification: With a clear view of the performance and potential of different business units, companies can diversify risk by balancing their investments across a range of units and markets.
Strategic Planning: The matrix assists in strategic planning, helping businesses identify potential growth areas, units that need attention, and areas where resources can be better allocated.
Cons of the GE-McKinsey Matrix
Complexity: The GE-McKinsey Matrix's comprehensive nature also adds complexity. The analysis includes multiple factors, each needing accurate data for rating and weighting, which can be resource-intensive.
Subjectivity: There can be subjectivity in defining factors, assigning ratings and weights, which can affect the accuracy of the analysis. Therefore, it requires a significant level of expertise and judgment.
Dynamic Market Conditions: The matrix represents a snapshot at a particular time point. It may not account for future changes in market conditions or internal business dynamics.
Overemphasis on Market Attractiveness: Some critics argue that the matrix places too much emphasis on market attractiveness and may undervalue the potential of business units in currently less attractive markets.
While the GE-McKinsey Matrix provides detailed insights for strategic portfolio management, businesses must understand its limitations. A company should use it as one of several tools in their strategic planning process, balancing its insights with other analysis models and business intelligence. It is also crucial to regularly update the analysis to keep up with changing market conditions and internal dynamics.
In summary, using the GE-McKinsey Matrix involves assessing the various factors that influence a business unit's success, rating and weighting them, plotting the results on the matrix, and deciding on strategic actions based on their position. This approach enables businesses to effectively manage their portfolios, balancing investments and resources across multiple departments.
However, it requires in-depth market analysis and honest internal assessment to be effective. This means that companies need to have an in-depth understanding of market trends, the competitive environment, their own strengths and weaknesses, and other aspects. Only in this way can the company accurately assess the strength of each business unit and formulate appropriate strategic actions based on its position in the matrix.
At the same time, the GE-McKinsey matrix also requires companies to continuously monitor and adjust. The market environment is constantly changing, and the internal situation of enterprises will also change over time. Therefore, companies need to regularly update their matrices to reflect the latest market and internal conditions.

There are free GE-McKinsey matrix template provided in Boardmix . Companies can use this template to simplify the process of evaluating and drawing the matrix, thus saving time and resources. This template can also help businesses more intuitively understand the structure of their portfolios, allowing them to make more informed decisions.
Join Boardmix to collaborate with your team.

Starbucks Value Chain Analysis

Amazon Value Chain Analysis
Apple Value Chain Analysis
Strategy Boffins
Consulting tools, ge/mckinsey matrix.
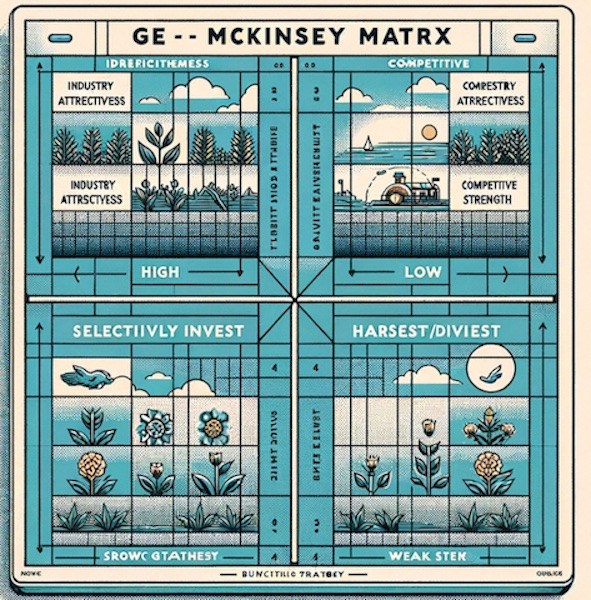
The GE/McKinsey Matrix is a strategic tool used in business to help companies decide where to invest their resources for the best returns. Developed in the 1970s by McKinsey & Company for General Electric, the matrix is a more complex version of the BCG (Boston Consulting Group) Matrix. It is designed to evaluate business portfolios and prioritize investments among different business units.
Overview of the GE/McKinsey Matrix
The matrix is a 3×3 grid that assesses business units on two dimensions:
- Industry Attractiveness : This includes factors such as market growth, market size, and profitability. It is plotted on the vertical axis, with higher positions indicating more attractive markets.
- Competitive Strength : This includes factors such as market share, brand strength, and product quality. It is plotted on the horizontal axis, with positions further to the right indicating stronger competitive positions.
Each business unit is placed within this matrix, allowing companies to categorize them into one of three zones:
- Invest : Units in attractive industries with strong competitive positions are considered for further investment.
- Selectively Invest : Units with medium industry attractiveness or competitive strength are selected for investment on a case-by-case basis.
- Harvest/Divest : Units in unattractive industries or with weak competitive positions are considered for divestiture or for strategies to maximize short-term returns.
Application
The GE/McKinsey Matrix is particularly useful for large, diversified corporations that need to allocate resources efficiently among different business units. It helps in making strategic decisions about whether to invest, develop, or divest in particular segments of the business.
Similar Tools and Methodologies
BCG Matrix : Similar to the GE/McKinsey Matrix, the BCG Matrix categorizes business units into four categories (Stars, Cash Cows, Question Marks, and Dogs) based on market growth and market share. It is simpler and more straightforward but does not account for as many variables as the GE/McKinsey Matrix.
Ansoff Matrix : Focuses on growth strategies by considering new vs. existing products and markets. It helps businesses decide on strategies like market penetration, market development, product development, and diversification.
Porter’s Five Forces : While not a portfolio analysis tool like the GE/McKinsey Matrix, Porter’s Five Forces is crucial for analyzing industry attractiveness by evaluating competitive intensity, potential entrants, substitute products, bargaining power of suppliers, and bargaining power of customers.
PESTEL Analysis : Offers a broader view of the external environment by analyzing political, economic, social, technological, environmental, and legal factors. This can complement the GE/McKinsey Matrix by providing insights into industry attractiveness.
Implementing the GE/McKinsey Matrix requires a thorough understanding of the market and internal capabilities, making it a powerful tool for strategic decision-making in complex business landscapes.
Value Net Model (Brandenburger and Nalebuff)
Resource-based view (rbv), time-based competition, experience curve, kirana store / grocery store strategy, value chain analysis, management by objectives (mbo), hoshin kanri (policy deployment), okrs (objectives and key results).

Collections
Captivating.
GE / Mckinsey Matrix
by kasi | Dec 25, 2010 | Strategy | 0 comments
Business portfolio management is a promising field of strategic management in view of the today’s competitive environment. Due to the risks associated with a single business because of today’s uncertain economic gestures in the global world the firms prefer to diversify in related and unrelated fields and create business portfolios to ensure minimum required returns. The management of these portfolios become a big task and requires strategic vision to ensure the eminent performance of the components of each portfolio.
GE Matrix or McKinsey Matrix has been developed by General Electric and Mckinsey in 1970s as a strategic tool for portfolio study. Boston Consulting Group first developed the BCG Matrix for similar purpose and GE is also analogous to the BCG Matrix. One can say the GE / McKinsey Matrix is actually an extension of the BCG Matrix. GE Mckinsey is a multifactor portfolio analysis tool which compares the different businesses on basis of two variables "Competitive Strength" and "Market Attractiveness". These two variables are further divided according to their intensity level i.e. high, medium, or low. This segregation permits the business managers to compare business or competitive strength and market attractiveness for diverse strategic business units (SBUs) or different product offerings.
The GE Matrix is an unconventional tool used in portfolio management and also called Directional Policy Matrix. It is mainly used to decide which products and business to include in the portfolio and to identify the less profitable products or SBUs needed to be divested. It also tells which brands, products, businesses have greater opportunities of investments and posses’ greater potential of return on the basis of the intensity of their competitive strength and market attractiveness.
As mentioned earlier GE Matrix is similar to the BCG Matrix, therefore, it is also plotted on a two dimensional lattice. The x-axis consists of competitive strength measures and y-axis shows market attractiveness. Competitive measures are usually represented by price, service standards, and research and development etc whereas market attractiveness is based on factors like price and profitability levels etc.
The products and services, brands, business units, or potential products are segregated into high, medium and low according to the market / industry attractiveness and business / competitive strength and are plotted in the chart. It is assumed in the below example that a company has A, B, C, D, E, F, G, H, I products in its portfolio and want to determine the appropriate strategies to be adopted keeping in view their market attraction based on pricing and profitability and competitive strength based on service standards etc. After measuring intensity of their marketability and competitive strength these products are plotted in the GE Matrix below:

The above GE Matrix reveals that the company should adopt following course of action for its portfolio of products:
• The products appearing in the top left of the GE Matrix are the potential products for the company. For example the product A shows high market attractiveness and high competitive strength. The firm should invest in the opportunities or products coming in the top left of the Matrix which are A, B, and D. The rationale behind is that the firm should exploit the opportunities which are both attractive and also show some degree of competitive advantage.
• [linkunit]The products appearing in the bottom right of GE Matrix show very low market attractiveness and are also competitive weak. These are the best candidates for divestures. In the above Matrix products F, H, and I are potential products for divestments. The firm should not waste its resources on these products.
•The products appearing in between are decision areas for the company either it should go into more investments or redouble its efforts to make them potential products in the hopes of future benefits or consider them for portfolio cuts or divestments. In the above matrix products C, E, and G are the candidates for any such treatment.
The GE/Mckinsey Matrix has fulfilled the shortcomings of the BCG Matrix through inclusion of number of variables not treated in the BCG Matrix. It takes into account market attractiveness instead of market share and includes large range of factors other than just market growth rate. On the other hand market share in the BCG is replaced by competitive strength which enables the company to assess competitive position of each product, or SBU. [sky]
Determinants of Market Attractiveness
Several variables determine the market attractiveness for a product, service, business, brand, or SBU and mainly include:
• Market volume • Market augmentation or growth • Market fertility or profitability • Pricing trends • Rivalry or competitive strength • Industry risk of return. • Market Segmentation • Distribution network
Determinants of Competitive Strength
Numerous factors establish the competitive strength for a product, service, business, brand, or SBU and primarily include:
• Potency of assets and competencies • Relative brand strength • Market share • Customer loyalty and preferences • Costing mechanism or cost composition relative to rivals • Distribution strength • History of technological or other advancements • Access to financial and other investment resources
Share this:
- Click to share on Twitter (Opens in new window)
- Click to share on Facebook (Opens in new window)
Submit a Comment
Your email address will not be published. Required fields are marked *
Notify me of follow-up comments by email.
Notify me of new posts by email.
- StumbleUpon
IMAGES
VIDEO
COMMENTS
EXAMPLES OF GE-MCKINSEY MATRIX (PRACTICAL IMPLICATIONS IN RENOWNED BRANDS) 1. Apple Inc. 2. Invest or Grow strategy of Ford electric car. 3. Divest or Harvest strategy by Microsoft in Zune mp3 player. MERITS OF GE-MCKINSEY MATRIX. LIMITATIONS OF GE-MCKINSEY MATRIX.
The GE-McKinsey Matrix (a.k.a. GE Matrix, General Electric Matrix, Nine-box matrix) is just like the BCG Matrix a portfolio analysis tool used in corporate strategy to analyse strategic business units or product lines based on two variables: industry attractiveness and the competitive strength of a business unit.
With the rise of multibusiness enterprises in the 20th century, companies began to struggle with managing a number of business units profitably. In response, management thinkers developed frameworks to address this new complexity. One that arose in the early 1970s was the GE-McKinsey nine-box framework, following on the heels of the Boston Consulting Group's well-known growth share matrix.
The GE Matrix is a strategic framework that helps multi-business corporations manage portfolios and prioritize investments across products and SBUs (Strategic Business Units). The GE Matrix looks at two factors: the competitive strength of an SBU and the attractiveness of the market in which it operates. Based on where the SBU sits within the ...
Definition. GE-McKinsey nine-box matrix is a strategy tool that offers a systematic approach for the multi-business corporation to prioritize its investments among its business units. [1] GE-McKinsey is a framework that evaluates business portfolio, provides further strategic implications and helps to prioritize the investment needed for each business unit (BU).
The GE McKinsey Matrix was developed in the 1970s after General Electric asked its consultant McKinsey to develop a portfolio management model. This matrix is a strategy tool that provides guidance on how a corporation should prioritize its investments among its business units, leading to three possible scenarios: invest, protect, harvest, and divest.
The GE-McKinsey Matrix, also referred to as the General Electric Business Screen, was first introduced in the 1970s by McKinsey & Company for General Electric. This strategic tool was intended to be an enhancement over the then popular Boston Consulting Group (BCG) Matrix. Unlike the BCG Matrix, which primarily uses market growth and market ...
The GE-McKinsey nine-box matrix is a strategy tool that offers a systematic approach for the multi-business corporation to prioritize its investments among its business units. In the 1970s, General Electric asked its consultants, McKinsey, to develop a portfolio management model that would suit it needs.
General Electric (GE) liked the visual aspect of BCG's matrix, but not the dimensions, so the company asked its consulting firm, McKinsey & Company, to create a model that better suited its needs. See the 3x3 GE-McKinsey Matrix (also called the McKinsey Matrix, the Business Strength Matrix, and the Nine-Box Matrix), shown in figure 1.
The GE McKinsey matrix, or the GE-McKinsey nine-box matrix, is a strategic framework that lets you evaluate your company's products, services, and strategic business units. When you know which products and services are most important to your company's growth, you better understand where to focus resources and time in your development efforts. ...
GE-McKinsey Nine-box Matrix can be used by considering the industry attractiveness and strengths of the product and business unit. The industry attractiveness can be determined by considering the industry size, profitability, environmental factors, pricing and labor requirements, etc. The industry attractiveness is plotted on the vertical axis ...
The GE Matrix's more detailed approach provides a deeper and more flexible analysis, but it can be more time-consuming and requires more data to implement effectively. Case Studies: Real-world Applications of the GE Mckinsey Matrix. To demonstrate the practical application of the GE Mckinsey Matrix, let's explore a few real-world examples:
The GE / McKinsey matrix is a model used to assess the strength of a strategic business unit (SBU) of a corporation. It analyzes market attractiveness and competitive strength to determine the overall strength of an SBU. The GE Matrix is plotted in a two-dimensional, 3 x 3 grid. The Y-axis measures market attractiveness based on a high, medium ...
The GE McKinsey Matrix is an excellent tool. It allows organizations to conduct effective portfolio planning based on the strength and industry attractiveness of each business unit. This nine-box matrix was created by McKinsey in the 1970s to help General Electric (GE) determine how to best invest in their business units.
The GE McKinsey matrix is a nine-box matrix which is used as a strategy tool. It helps multi-business corporations evaluate business portfolios and prioritize investments among different business units in a systematic manner. This technique is used in brand marketing and product management. The analysis helps companies decide what products need ...
GE/McKinsey Matrices differ from similar tools, like the Boston Consulting Group Matrix, in that multiple factors are used to define industry attractiveness and business unit strength. Grouping the variables of a problem and their effect on performance in three classes is the major advantage of the GE/McKinsey matrices in
GE Matrix or McKinsey Matrix or GE-McKinsey Matrix. All of them are the names of this strategy tool that helps you analyze your product portfolio. ... [Case Study] A good marketing strategy is one which integrates with the people, systems, culture and the structure of the organisation. Here, I share with you my study of what makes the Zoho ...
The GE-McKinsey Matrix, or attractiveness/strength matrix, is a strategic decision-making tool that facilitates the management of a portfolio of activities within a company. This model makes it possible to analyze each of its strategic business units (SBUs) along two dimensions: their competitive strengths and market attractiveness.
To better understand the practical application of the GE-McKinsey Strategy Framework in M&A, let's examine a case study involving MediCool Health, a US-based healthcare organization, and HealthAI ...
The GE Matrix in Strategic Management: Pros and Cons. The GE-McKinsey Matrix is a popular tool for strategic portfolio management, allowing businesses to plot their different units or products based on market attractiveness and business strength. Like any strategic tool, it has its advantages and limitations. Pros of the GE-McKinsey Matrix
The GE/McKinsey Matrix is a strategic tool used in business to help companies decide where to invest their resources for the best returns. Developed in the 1970s by McKinsey & Company for General Electric, the matrix is a more complex version of the BCG (Boston Consulting Group) Matrix. It is designed to evaluate business portfolios and ...
GE Matrix or McKinsey Matrix has been developed by General Electric and Mckinsey in 1970s as a strategic tool for portfolio study. Boston Consulting Group first developed the BCG Matrix for similar purpose and GE is also analogous to the BCG Matrix. One can say the GE / McKinsey Matrix is actually an extension of the BCG Matrix.
The GE-McKinsey Strategy Framework, also known as the GE-McKinsey Nine-Box Matrix, is a strategic management tool designed to assist organizations in making decisions on resource allocation and investment prioritization. ... To better understand the practical application of the GE-McKinsey Strategy Framework in M&A, let's examine a case study ...