
The A3 Problem-Solving Template: A Structured Approach for Lean Organizations
Last updated: November 1, 2023
By Alexander Connor
Discover how the A3 problem-solving template can help lean organizations effectively solve problems and improve processes, enabling them to make informed decisions and drive continuous improvement in a world that constantly demands increased quality and reduced costs.
The A3 problem-solving template is a widely adopted tool in lean organizations. This structured approach allows businesses to effectively address various problems and drive continuous improvement.
By following a logical and structured approach within the four-stage model based on the PDCA (Plan – Do – Check – Adjust) management philosophy. A3 report templates enables the visibility of problem-solving progress and shared learning among teams, improving the decision-making processes used in the organization.
In a time when efficient problem-solving is crucial, it’s important for leaders, coaches, and project teams to have the ability to think critically and make informed decisions that can be reviewed and understood by all parties involved.
The implementation of A3 management process can notably enhance the quality of decision-making processes, increasing the capability of teams to confront the root causes of diverse difficulties.
Providing a consistent structure to the problem-solving process, the functionality of the A3 report templates has expanded well beyond its original purpose. Industries worldwide, from manufacturing to retail to healthcare, have begun to embrace this tool in their problem-solving initiatives.
What is the A3 Problem-Solving Template?
The A3 problem-solving template is a one-page report format originally developed by Toyota , a company well-known for its lean thinking. The design of the ledger size paper encourages concise communication and collaboration among team members, as it requires the problem definition, root cause analysis, countermeasures, and follow-up plan to fit on a single page.
Here’s a quick rundown of the components of an A3 problem-solving template:
- Background : A brief explanation regarding the importance of the issue, spanning no more than three to four sentences.
- Current State : Describes the current situation, detailing the problematic area that needs to be addressed.
- Future State / Goal : Highlights the objective or desired state that your organization wants to achieve after resolving the issue.
- Analysis : Incorporates root cause identification and root cause analysis, using tools like fishbone diagrams , Pareto charts, or 5 Whys, to identify the underlying concern.
- Recommendations : Suggests countermeasures to tackle the issues identified during the analysis phase. The proposed solution should aim to remove the root cause of the problem.
- Follow-Up : Stresses an action plan for the implementation plan of the recommended solution, allocating responsibilities to team members, and designating a timeline for completion.
Lean organizations leverage the A3 problem-solving template as a tool to improve their problem-solving initiatives. This is done by encouraging rationalization among team members to ensure a systematic and holistic problem-solving process.
This form of communication and collaboration brings out the best skills in team members and can be applied across various areas within a business, ranging from manufacturing and supply chain to customer service and process improvement.
Benefits and Applications
The A3 problem-solving template offers an array of benefits to lean organizations. It essentially simplifies the complexity of problem-solving and injects an organized approach to an otherwise daunting task. Here are some key benefits that come with the application of the A3 template:
- Promotes clear and concise communication : The A3 template condenses complex problem-solving steps into a single page. This requires teams to communicate the essential elements of the problem, the analysis, their recommendation, and action plan in a clear, simplified manner. This clarity of communication ensures that every team member, regardless of their expertise, is on the same page.
- Encourages root cause analysis : The template frames problem-solving in the context of root cause analysis. It forces teams to not just focus on symptoms or immediate fixes, but encourages them to dive deeper to identify underlying root causes.
- Facilitates data-driven decision-making : Through requiring an analysis of the current state and concern, the A3 template promotes fact-based, data-driven decisions. This results in more effective and sustainable solutions, as decisions are made based on analysed data and not guesses or assumptions.
- Enhances collaboration and feedback : As the template necessitates input at multiple stages, it forges cohesive relationships among team members. It also promotes feedback at each stage of the problem-solving process, ensuring a more refined and effective solution.
The A3 problem-solving template is a universal tool that can be applied across various departments and diverse industries such as manufacturing, healthcare, retail, construction, etc.
A3 Report Templates and Resources
Several A3 templates and resources are available to assist organizations in implementing the A3 problem-solving structure. These templates equip teams with a standardized structure that guides them through the process of problem definition, root cause analysis, countermeasures, and action planning.
In addition to templates, the market offers a myriad of books and training resources on lean and agile methodologies to enhance the understanding and application of the A3 problem-solving structure.
There are resources available specially designed for all lean organizations, whether they are just starting their lean journey or are well-established lean practitioners, to ensure a smooth transition to adopting the A3 reporting system.
Several online platforms and software providers also offer A3 report templates tailored to business requirements, making it simpler for organizations to adopt this problem-solving tool and providing them with opportunities for continuous improvement and learning.
A3 Problem-Solving
The A3 problem-solving template is an invaluable tool for lean organizations aspiring to boost their capability in problem-solving and stimulating continuous process improvement.
By utilizing this structured approach, teams can effectively handle diverse challenges, promote collaboration, make data-driven decisions, and effectively bring continuous improvement into their daily operations with the help of A3 report templates and resources.
In a nutshell, the A3 problem-solving template ingrains a problem-solving culture into organizations, empowering teams to excel in their problem-solving skill sets and consistently deliver improved operations. It’s more than a mere problem-solving tool; it’s a mindset shift towards heightened efficiency and efficacy.
Embrace it today, and witness the transformative power of A3 structured problem-solving for your organization. Unlock the potential to navigate challenges and drive continual improvement proactively, helping your organization adapt and thrive in the ever-evolving business environment.
- Recent Posts

- Advantages of Cloud Print Management - August 8, 2024
- Top Features of Enterprise Risk Management Software - July 18, 2024
- Lithium-Ion Battery Integration with Renewable Energy Systems - July 16, 2024
Related Posts:

Safety Protocols: Handling and Using Lithium-Ion Batteries in Electric Vehicles
July 3, 2024
Implementing the Age Appropriate Design Code: Protecting Children’s Data Online
August 21, 2024
Join our newsletter for the latest battery technology news & guides
Contact Info
Office Address: 2233 Heritage Road Fresno, CA 93721 Call us: +1 559-767-6498
Copyright 2024 © IonCore Technology. All Rights Reserved.
Privacy Policy
- Register for Congress!
- MY LCI Login
- LCI Design & LCI Engineering Design Award
- Our Mission & Vision
- Our Strengths
- History of LCI
- How We Serve
- Board of Directors
- LCI Congress 2024
- Lean in Design Forum
- Respect For People
- Communities
- New to Lean
- Learn by Pathway
- For Designers
- For Constructors
- Field Crew Huddle
- Assessments
- Classroom Learning
- Instructor Program
- LCI Publications
- Learning Videos
- Partner Programs
- Simulations
- Certification FAQs
- Certification Practice Quiz
- Designation Directory
- Lean Construction
- Lean Design
- Lean Project Delivery
- What is Lean?
- Founder’s White Papers
- Lean Construction Journal
- LCI Research
- Newsletter Archives
- Past Event Presentations
- Blog & Buzz
- Lean Consultant Members
- Member Directory
A3: Thinking, Reports, Examples & Templates
A3 thinking.
An Introduction to A3
In the design and construction industry – as in all industries – complex problems arise daily. Each project contains hundreds of decisions containing thousands of variables, and sorting them out to arrive at the best outcome is critical.
A3 problem solving provides teams with a strategy to effectively and efficiently deal with problems that they encounter and decisions that need to be reached. In true Lean fashion, A3 process improvement brings the entire team into the collaborative problem-solving process and allows teams to embrace out-of-the-box solutions.

What is A3?
An A3 is a one-page report prepared on a single 11 x 17 sheet of paper that adheres to the discipline of PDCA thinking as applied to collaborative problem solving, strategy development or reporting. The A3 includes the background, problem statement, analysis, proposed actions, and the expected results.
The History
A3 thinking was developed by Toyota in the 1940s. Toyota believed that any problem should be capable of being explained and solved using one sheet of paper (an 11 x 17 sheet being the largest sized paper that is capable of being faxed and closest in size to the traditional A3).
The company also believed that if a problem is too complex to fit onto an A3 report, it should be broken down into smaller bits that would be solved individually. If your problem cannot fit onto an A3, you should reconsider the scope of what you are hoping to accomplish.
Who Uses A3 Strategies?
Today, A3 strategies are deployed across various industries that employ Lean thinking such as:
- Design & Construction
- Manufacturing
- Project Management
- Engineering & Architecture
- Service Industries
LCI’s Meaning of A3
A3 thinking is an extremely useful tool when utilized correctly. By distilling the entirety of a problem on a single sheet of paper, A3 Lean thinking forces team members to collaborate and rationalize through the problem solving process. A3 thinking makes for more effective problem solving and produces written explanations that can then be passed on to senior management. An effectively completed A3 report will also build management’s confidence in the team and its ability to solve problems.
A3 Reporting
A well-written A3 report should show and explain the consideration that went into the counter-measure to the problem listed. Properly executed plans include the input of team members from all across the stakeholder spectrum and should allow members to emerge as leaders in its problem solving. A3 papers can also be referenced later, allowing the lessons learned during the process to be shared with future project teams.
Understanding A3 Thinking
A3 thinking does not provide a solution to the problem your team is facing. Rather, it guides your team’s process to help it reach the best possible countermeasure with the tools it has at its disposal.
An A3 report is to be filled out by one person on the team – the “champion” – who will gather assessments and intel from other members in a collaborative fashion. Bringing all of the knowledge and expertise of the team to bear when solving a problem is the best way to come to a satisfying outcome.
Problem Solving: An A3 Process
A3 thinking allows for many different types of decision-making. But ultimately, all decisions are fundamentally a form of problem solving. For example, A3 thinking can be deployed to guide the team in optimizing decisions during the design phase, or for solving a constructability challenge.

The First Step to A3 Thinking
The first step of the A3 process for problem solving is to correctly identify the problem. From unexpected lead times on materials to communication breakdowns among design teams, “problems” are in no short supply in the design and construction industry. Before engaging in A3, ask yourself the following questions about the problem you are working to solve.
Questions to Facilitate the Process
- What are you trying to address or solve?
- What is the current situation?
- What are clear Conditions of Satisfaction (CoS) I can develop?
- Where can I brainstorm and analyze the 5 whys/root cause ideas?
- What’s a recommendation I can put forth?
- What is my plan to implement the recommendation above (if applicable)?
State plan to check and adjust using the PDCA cycle.
More on the PDCA Cycle
PDCA stands for Plan, Do, Check, Adjust. Explore each element of this acronym for more information about how it supports both the problem solving questions above as well as A3 problem solving as a whole.
Identify an issue in your process and exercise continuous improvement by planning your course of change.
Perform your case study by applying the corrective actions outlined in the “plan” stage in an experimental manner.
Follow the performance of your experiment and measure it to determine whether it is having the desired effect.
If your plan worked, implement the change to the necessary areas of your process. If it did not, determine what you will do differently next time and repeat the cycle.
A3 Reports for Solutions
While A3 reports broadly follow the PDCA cycle, the actual journey of an A3 process is a bit more granular. Let’s analyze the various steps and sections of an A3 report.
Describe the problem, theme, or issue. List out all of the details including the champion’s name, date, and the names of all of the collaborators who will be helping with the report.
Establish the business context & importance. Provide additional information on the problem being addressed.
Current State
Describe what is currently known about the problem. Note potential variables and roadblocks that may stop your team from solving this problem and additional information you hope you acquire.
Future State or Goal
Identify the desired outcome for your experiment. Identify the Conditions of Satisfaction (CoS) for the project.
Analyze the situation and underlying cause.
Recommendation
Provide a recommendation for process improvement that your team can implement for the future.
Create a follow-up/review process.
A3 Examples
A3 thinking is frequently applied in Lean design and Lean construction during all phases of the process for the purposes of making sound decisions. In the example below, A3 thinking is applied to the process of learning Lean design and construction techniques.

A3 Template
The Lean Construction Institute seeks to educate companies all throughout the design and construction industry on Lean practices and methods. Here is our A3 template which you can use to guide your decision-making processes.
A3 Training
The Lean Construction Institute offers A3 training as well as tools , events , education , and networking opportunities for Lean practitioners in design and construction all around the world. Whether you’re a Lean expert or are just learning about Lean for the first time, LCI can provide the tools you need for problem solving and continuous improvement in your business.
Lean Assessments
How strong is your Lean knowledge? Take a Lean assessment to determine your current state so you have a baseline for improvement. Lean assessments are available for individuals, teams, and organizations alike. Whether you’re new to Lean or are an experienced Lean practitioner, Lean assessments are a great way to get started at LCI!

William R. (Bill) Seed, Executive Editor

Executive Editors: Kristin Hill, Katherine Copeland and Christian Pikel
More lean topics.
From 5s to IPD, explore more popular Lean design and construction topics below.

- Consultancy
- Online Courses
- Lean , Lean Culture , Lean Training , Lean Wiki , Tools
A Deep Dive into the A3 Problem-Solving Approach
- 11 mins to read
- June 20, 2023
- By Reagan Pannell
In today’s fast-paced and fiercely competitive business world, organisations must find ways to continuously adapt, evolve, and excel. Amidst the myriad methods and techniques for achieving improvements and driving continuous improvement , few have proven as profound and transformative as Toyota’s A3 problem-solving approach.
A significant driving force behind the company’s rise to global prominence, the A3 process fosters a culture where problems are embraced as opportunities for growth and learning. In this article, we’ll explore the origins and underlying principles of the A3 approach and uncover the secrets to its success in unlocking the power of improvements.
Understanding the A3 Approach
The A3 methodology is an integral part of the Toyota Production System (TPS), a set of principles and practices that have shaped the company’s approach to manufacturing, management, and continuous improvement over the years. Named after the A3 sheet of paper that was historically used to capture the plan, analysis, and follow-up on a single sheet of paper, typically an A3-sized sheet, the A3 process represents a simple, yet powerful, tool for addressing complex challenges and discovering lasting solutions.
At its core, the A3 approach is rooted in three key elements:
Thorough problem analysis : The foundation of the A3 process lies in digging deep to diagnose the true nature and root cause of an issue, rather than jumping to hastily devised fixes that merely address symptoms.
Structured documentation: The A3 report serves as both a communication tool and an iterative planning device, with each section building on the previous ones to guide problem solvers through a comprehensive analysis, solution development, and execution process. It’s the foundation of good continuous improvement.
Cyclical learning and improvement: Leadership and employees alike are encouraged to commit to hypothesis-driven inquiry, observation, experimentation, and reflection, leading to a culture that actively seeks and leverages opportunities for growth by solving problems.
How to Implement the A3 Process in Your Organisation
The Lean Thinking A3 approach can be distilled into seven essential steps:
1. Identify the problem:
Clearly articulate and define the issue at hand, avoiding the temptation to jump to solutions or assume important facts to be self-evident..
When identifying the problem, it is important to ensure that all relevant stakeholders in the organisation are consulted. This helps to ensure that the issue is accurately described and understood from multiple perspectives. A thorough problem analysis should also include conducting research into possible causes or root issues, and clearly documenting any observed symptoms of the problem. Additionally, it is essential to identify any major risks associated with not finding a solution and recognise any constraints (both external and internal) that may exist which could limit potential solutions. Lastly, it is important to consider any potential opportunities which may arise from addressing the issue that may have been overlooked at first glance. This is the problem statement part which is a critical component that identifies the difference between the current condition and the target condition.
At this stage, we are not looking at how to solve problems being faced or at the potential solution to solving problems. It’s about developing a good understanding of how the actual results differ from the expected results and providing an in-depth systematic approach to process improvement and developing problem-solving skills.
2. Establish the context and background:
Provide a high-level overview of the problem, describing the stakeholders involved, relevant data, and the broader organisational context in which the challenge has arisen..
It is important to ensure that all stakeholders are properly considered when identifying any potential solutions as their perspectives can play a vital role in determining an effective solution. All related data should be thoroughly analysed to understand the full scope of potential solutions. This includes resources, costs, timelines, and any legal or regulatory issues that may need to be considered. Additionally, it is important to consider how well-proposed solutions fit within existing organisational policies and procedures as this could impact implementation success. Finally, understanding how proposed solutions would interact with other initiatives or processes currently taking place in the organisation can help inform decisions about whether or not they are viable options. It may include conducting some value stream mapping to dig deeper into the current state.
It is important to fully explore any underlying factors that may be contributing to the issue at hand and ensure in-depth problem analysis. This includes looking deeper into existing systems, structures, and processes related to the problem in order to identify potential areas of improvement or optimisation. Additionally, it is essential to consider any relevant industry trends or external influences that could impact how the problem manifests within the organisation.
When analysing a problem, collecting data from various sources is important to get a more comprehensive understanding of how a particular issue can be addressed. This includes mapping the current process using the VSM, SIPOC , Process Mapping or Flowcharting techniques. Additionally, interviews and surveys can be conducted with stakeholders to gain insights into how they perceive the issue and their perspectives on potential solutions. Lastly, it is important to observe any real-world activities related to the problem to uncover key areas where time, effort, resources, money etc is being wasted. This is the time improvement that may not have been identified otherwise.
GB MASTERCLASS COURSE
Get access to our free gb mastercourse classes, free course previews, fundamentals of lean.
Ready to start your journey into the world of Lean with this free course?
FREE COURSE
Lean Thinking
A Lean focused continious improvement certification course
LSS Yellow Belt
Propel your career forward, tackle complex problems and drive change
LEAN SIX SIGMA GREEN BELT
Get 3-days free access to our green belt course, accelerate your career, 3. set a goal:, now that you have identified the problem and outlined the relevant context, it is time to set a project goal or outcome..
This involves clearly articulating the desired state of affairs and any key deliverables of the proposed solution. Whether it is reducing operational costs, increasing efficiency, improving customer experience, or something else entirely – defining specific objectives with measurable metrics can help ensure that project teams stay focused and remain aligned on their ultimate destination.
At this stage, it is also important to consider how long it will take to reach the desired outcome. Establishing an implementation timeline will help safeguard progress and provide a framework for tracking results along the way. Setting milestones for achieving particular goals at certain points in time can be especially helpful in keeping teams accountable throughout the process. Additionally, having a plan for evaluating success after reaching the end target will allow stakeholders to gain further insights into how effective their approach has been in addressing underlying problems, as well as how well-proposed solutions have fared once implemented.
4. Investigate root causes:
Use a variety of techniques (e.g., the 5 whys, fishbone diagrams, pareto charts) to probe the problem’s underlying causes and avoid settling on proximate reasons..
The process of identifying root causes is essential when using data-driven tools. We always want to find the simplest root cause approach.
One of the most widely used methods for root cause analysis is the ‘5 Whys’ technique. This method involves asking a series of ‘why’ questions to determine the underlying cause of a particular symptom or issue. The goal is to keep asking “Why?” until you reach an answer that can provide insight into how to address the problem and prevent it from occurring in the future.
Another commonly used tool for root cause analysis is the fishbone diagram (also known as Ishikawa diagrams). This approach involves visualising all potential causes which could be causing a symptom or issue in a logical format, allowing users to identify patterns and uncover links between root causes and their respective effects. This technique can be helpful in identifying and focusing on key areas for improvement, as well as helping to identify interdependencies between components within an organisation’s systems.
Finally, Pareto Charts are useful for analysing data collected from surveys, interviews, observations, etc., concerning the severity or frequency of occurrence. This type of chart helps users quickly identify which factors are contributing most significantly towards an issue, allowing them to focus resources towards addressing those areas first and foremost. Additionally, Pareto charts can also be used to prioritise different solutions based on their estimated effectiveness in addressing an issue.
In conclusion, understanding the root cause of an issue through rigorous techniques such as 5 Whys, fishbone diagrams, and Pareto charts provides invaluable insight into how best to address it effectively while preventing it from reoccurring in the future. By leveraging these tools along with other data-led approaches such as process mapping and flowcharting, organisations can ensure that any proposed solutions are well-informed by both qualitative and quantitative data sources as well as ensure they are building consensus across the entire organisation.
5. Countermeasures:
Identify the right countermeasures (corrective actions) to implement that will directly impact the root causes identified..
Brainstorming is a useful tool for identifying potential improvements. It involves coming up with ideas and solutions in an open and collaborative manner, without judgement or criticism. By allowing team members to share their thoughts freely, brainstorming can help uncover innovative solutions that may have otherwise gone unnoticed. Additionally, looking at how waste reduction, flow and pull can be used to improve processes can also provide valuable insights into where improvement opportunities lie.
Brainstorm potential solutions that directly target the root causes and create detailed action plans for implementation, complete with assigned roles, responsibilities, and timelines.
Once the countermeasures are identified, it is important to design an implementation plan and assign roles & responsibilities. This will help ensure that all stakeholders understand their part in the implementation and can work together to achieve the desired outcome. Additionally, it is important to track progress along the way – setting measurable milestones that can be tracked against goals established during the initial problem-solving phase will help keep teams accountable and allow for course corrections if needed.
By utilising A3 Problem Solving Tools such as a template, organisations can easily document and share their analyses with relevant stakeholders throughout each stage of the project. Having detailed record-keeping like this also helps teams stay on target over time while providing insights into how proposed solutions may need to be re-evaluated down the line. This implementation plan provides the entire organisation with a clear project status on a one-page report.
6. Evaluate the results:
Measure the impact of your countermeasures against the problem, using well-defined success criteria, key performance indicators, or other relevant metrics..
Once the countermeasures have been implemented, it is essential to measure and evaluate their success. This can be done by tracking performance against the initial objectives established during the goal phase, as well as establishing key performance indicators to gauge how well the proposed solutions have fared.
Additionally, stakeholders should also consider conducting a post-implementation evaluation in order to assess how successful their approach has been in addressing underlying issues and determining what lessons can be learned from the experience. This will enable teams to identify strengths and weaknesses within their existing processes and make any necessary adjustments going forward. By understanding the outcomes of their improvements, organisations are able to gain valuable insights into how well they’ve succeeded in achieving their goals and ensure continued success moving forward.
Once the countermeasures have been implemented and their success measured, it is important to compare the results against the initial objective. This can be done in a variety of ways, including graphical analysis such as charts, process maps or flow diagrams. Graphical analysis helps to visualise the differences between results achieved before and after the implementation of new measures in a meaningful way. It also provides an increased level of clarity when assessing whether the desired outcomes have been achieved or not.
Process maps can be useful in understanding how changes made during the improvement phase have impacted processes within an organisation. By mapping out existing processes and then comparing them against those following implementation of countermeasures, teams can easily pinpoint where improvements were made and analyse how they led to improved performance overall.
Charts, on the other hand, enable users to quickly identify trends that may have emerged from data collected during the project. For example, if performance metrics are tracked before and after countermeasures are implemented, users can use charts and graphs to more clearly observe any patterns that may indicate an improvement or regression in performance over time – providing further insights into which areas need further attention or adjustment moving forward.
Finally, dashboard views provide an effective means of displaying results at a glance while highlighting any anomalies that might warrant further investigation. Dashboards allow stakeholders to gain access to important information quickly and easily while also helping them keep track of progress towards goals set out during initial problem-solving phases. Additionally, because dashboards support data visualisation capabilities they offer a highly interactive user experience which can help teams understand underlying trends with greater clarity and precision.
7. Standardise and share:
If a countermeasure proves successful, integrate it into the organisation’s standard operating procedures and share it with other teams as a best practice..
Once the countermeasures have been successfully implemented and measured against the initial objectives, these changes need to be integrated into the organisation’s standard operating procedures (SOPs) and shared with other teams as best practices. This will ensure that any improvements made during the problem-solving phase are consistently applied across all teams within the organisation.
In order to ensure that these improvements become part of the organisation’s long-term strategy, process maps should be updated to reflect the new improved way of working. Process maps provide a visual representation of how workflows are structured within an organisation, and by updating them in line with newly-implemented countermeasures, organisations can ensure that their processes continue to remain up-to-date and efficient moving forward. It may also be necessary to build a follow-up plan if not all tasks are fully completed as well as develop a Lean-focused PDCA cycle to ensure long-term effective collaboration on the solutions that were implemented.
Process documentation should also be updated in order to keep track of changes made during problem-solving. By documenting not just the solutions that were proposed but also why they were proposed, teams can gain valuable insights into their decision-making process which they can leverage for similar future problems.
Furthermore, it is important to update key performance indicators (KPIs) to accurately reflect any progress made during problem-solving. By tracking performance against objectives established before and after countermeasures were implemented, organisations will be able to identify any areas that may still need improvement or require further adjustment going forward. Additionally, tracking KPIs over time will help teams understand whether or not their current strategies are leading them towards meeting their goals in a timely manner or if additional measures may need to be taken in order to achieve desired results more quickly.
Finally, organisations should share successful solutions with other teams in order to promote collaboration and knowledge sharing amongst stakeholders throughout different parts of the business. This will allow for ideas generated through one team’s problem-solving efforts to benefit multiple departments – helping foster creativity and innovation while ensuring that everyone is on board with necessary changes being made throughout the organisation. The last step is key to Toyota’s PDCA management system designed for the entire organisation.
By breaking down the problem-solving process into these seven discrete stages, the A3 method offers practitioners a comprehensive, end-to-end framework for tackling complex challenges and driving improvements in any organisation.
- Lean Consultancy
- Corporate Training
Training the team on A3
To get A3 started, everyone in the entire organisation needs to learn how to use this single-sheet or single-page document. This means training people across all parts of the company so that everyone knows how to use the A3 Problem Solving Tool and A3 template. Training will help make sure that everyone follows a structured approach when using an A3 problem solving method, which is derived from Lean management and Six Sigma methodologies.
Getting the organisation fully onboard with A3 Problem Solving is not an easy task and will require a dedicated effort to ensure its successful implementation. To this end, it is important to start with specific areas of the business – whether it be operations, finance or marketing – by setting up targeted training sessions for both operational teams and senior managers. This will help everyone understand how and why A3 is used, as well as the potential benefits it can bring to their business.
Once everyone has mastered the basics of working with an A3 template, companies should look to regularly review and evaluate its effectiveness. This could include setting up quarterly reviews or running workshops where teams discuss successes and areas for improvement when using the A3 tool. Doing this will ensure that any issues are identified early on, allowing the team to quickly adjust accordingly.
At Leanscape, we understand that transitioning to A3 Problem Solving can be a daunting task. With our team of specialists, we can provide your teams with the necessary training and coaching to ensure that they are able to adapt quickly and efficiently. Our comprehensive approach to A3 will equip your team with the knowledge and skills needed to successfully use this powerful tool for improving performance in all areas of your business.
We are committed to helping you develop a culture of continuous improvement within your organisation by teaching best practices and providing guidance through every step of the problem-solving process. Through our specialised training programs, we will help your teams learn how to use the A3 template more effectively, as well as how to interpret data visualisations quickly and accurately – enabling them to take action swiftly when required. Our experienced coaches will also share insights from industry experts on how best to integrate countermeasures into standard operating procedures (SOPs) and process maps, keeping up-to-date with industry trends in order to stay ahead of the competition.
By leveraging Leanscape’s expertise in A3 Problem Solving, you can rest assured knowing that your team is in good hands. Our team is dedicated to providing you with the support needed for successful implementation so that you can achieve sustained performance improvements over time.
100% Free Fundamentals of Lean COURSE
Take our free course.
JOIN FOR FREE
Lean Six Sigma Yellow Belt Certification Course
The implementation of A3 Problem Solving provides a comprehensive framework for organisations looking to successfully address complex problems in an efficient and cost-effective manner. By breaking down the problem-solving process into seven distinct stages, users can structure their approach and track the progress of their countermeasures over time.
In order to ensure successful implementation, organisations should dedicate time towards training their teams on how to use the A3 Problem Solving Tool and A3 template. This will give everyone a solid foundation for carrying out future problem-solving activities more effectively, as well as provide insights into the effectiveness of certain countermeasures over time.
Through Leanscape’s specialised training programs, you can ensure that your team is fully equipped with the necessary skills to successfully adopt and incorporate A3 problem-solving into all areas of your business. Our experienced coaches are committed to helping you develop a culture of continuous improvement within your organisation – providing guidance through every step of the process.
Final Thoughts
The A3 approach is an invaluable tool for unlocking the power of improvements within any organisation. By leveraging its structured framework and cyclical learning approach, businesses can remain agile and responsive to ever-changing conditions, allowing them to navigate change more successfully and emerge stronger than ever before. Ultimately, this makes Toyota’s A3 problem-solving process one of the most effective ways to ensure long-term success in today’s fast-paced and competitive market.
Stay current with our latest insights
- Lean Six Sigma Yellow Belt Course
Our Training Courses
- Lean Six Sigma White Belt Course
- Lean Thinking Business Course
- Lean Six Sigma Green Belt Course
- Lean Six Sigma Black Belt Course
Yellow Belt Course
View all courses, recent articles, failure as a catalyst for growth, value stream mapping as a strategic tool, latest business book reviews, leanscape announces leadership coaching services, unlock business innovation with the lean business model canvas, 2024 recommended reads for transformative thinking, view all articles, green belt course, other articles, what are the different types of wastes in lean (muda, muri, mura), 04 – am i adding value, how assumption busting can help you solve problems more effectively, 5 corporate training programs every employee should take, 5 essential problem-solving strategies every business leader should know, newsletter | investing in yourself to make lasting change, what is a cause and effect diagram fishbone or ishikawa, the average is always wrong, what is 5s and what are the benefits, examples of histograms and how to create one, what is the 1 sample t-test, project management key skills: a lean perspective.
- | lean , lean thinking , problem solving , toolkit , tools
Related Articles
Mastering the art of lean manufacturing with an online degree, an operational excellence training program delivers $4m in costs savings, sources of error in measurement in research methodology: bias and precision – leanscape, smed and the reduction of changeover times, design of experiments: an overview, lean six sigma online courses.
FREE COURSE | YELLOW BELT | GREEN BELT | BLACK BELT | MASTERCLASS | WORKSHOPS
Lean Accelerator Progam
A Lean Six Sigma Green Belt Masterclass
LSS Green Belt
The ultimate fast-track for future leadership
LSS Black Belt
Become an expert in change management and complex problem-solving.
Subscribe to Newsletter
Keep up to date to the latest insights, courses, training, webinars and more. Join our newsletter today.
Ready to Level-Up
Discover the power of problem-solving, join our free course | get certified.
VIEW ALL COURSES
Lean Accelerator Program
15 min per day | 3-months | only €999 | learn from experts.
Six Sigma Mania
Download many Lean Six Sigma Templates
How to use A3 report – example and template for free
A3 report is one page report about project progress, its background, and challenges. It is easily explanation tool for broader audience, and stakeholders interested in the project.
this article contains:
What is A3 problem solving report?
A3 report out as a option, steps to create a3 report, a3 report example – restaurant improvement, a3 report at project start, a3 report as project progress, a3 report at project end.
- A3 report template download

Hot news, folks. In order to help you as much as I can in your improvement efforts, I have launched non-binding consultation program. I would like to help you with:
- Lean culture implementation in your organization
- Six Sigma projects consultations
- Lean Six Sigma trainings and certifications support
- Project management theory turn into practical usage
- Your career planning
First 30 minutes of consultation for free, every additional 1 hour 10 USD.
On a literal level, A3 refers to a paper size 29.7 x 42.0 in cm 11×17 in inches. In the lean six sigma world, we use this report out tool to show teams thinking, when addressing project goal. Use A3 during whole project life cycle. Create A3 right after project charter creation.

Six sigma tools to use in your (not just) first project – read here
Well, I suggest to agree with stakeholders, the way they want to see project report out. There are different ways possible. And A3 is one of possibilities.
So, no need to use A3 in every project. But be consistent, once using it.
A3 creation, preparation and updating is much faster, than creating presentation for example. It is simple to use and read. It is great tool, when presenting more projects updates in one meeting. A3 helps team focusing on the project goal and its deliverables, and makes it much simpler to review progress for those interested in the project.
5 simple Green belt project ideas – read here
A3 form template, is available for download in the end of this article. For free. Use it, share it.

These are areas should be filled at project beginning, as already mentioned.
- Project name,
- Current state pains
- Project goal, and the
- Section with team information
It takes some time with working on projects following DMAIC. But it worth it. So, do not jump into the solutions however attractive and tempting it would be. Try to understand current problem, identify your ideal state, and create a plan to reach it.

Here is a link to download project charter template for your usage, with the brief description of each section. You are free to share and distribute this list.
I do videos, blog posts, and all templates for free, in my free time. I will appreciate if you can donate me a cup of cofee, for more energy in my creation. (1 dollar counts, too 😉 Click on this link: I would like to support Erik in his effort
A3 sections to be updated this way..
- Create 4 sections prior project start, as mentioned.
- Develop high level activities and their schedule in project beginning together with team. It can be DMAIC phases at beginning. You can add more details as progressing with project.
- Update the rest of A3 areas with project progress. Do the update together with your team.
- Review A3 during one on one project progress review with sponsor, prior showing to stakeholders.
- Update stakeholders regularly. Minimally after finishing each project phase.
What are Six Sigma project types? (+templates) – read here
Let me share an A3 report example with you. A3 refers to my earlier video – improving fast food restaurant, called “Eating mania”.
OK, you can argue, that there is no real stakeholder in this project, to whom to report out. It is true statement. I will show correlations between project, and reporting out progress by A3.
Restaurant owner has a problem with very slow business growth. And he would like to develop process, that would bring 15% more customers in 3 months. This is perfect project goal.
Download DMAIC tools list, I suggest allways to follow.

22 green belt certification companies prices review – read here
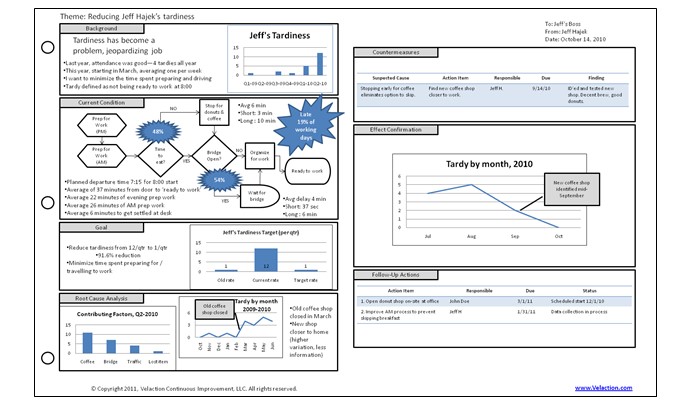
And this is how A3 would look like when project starts:

Team have developed high level project plan right after project kick off. There are leaders of each step, time frame where each step should be addressed. It needs teams discussions to define those steps, when there is no experienced leader.

How to select your first green belt project? – read here
As team is progressing, accomplished tasks are updated with current status. Additional information, as Analysis, and project challenges is provided to the report. Use pictures, graphs or other visualization to show used tools in the analyze section.
Follow ups and challenges are here to share with stakeholders and sponsor, what difficulties team is facing. You might ask for helping hand in the case team is stuck up.
You can update any A3 section accordingly, as project goes on. It must reflect reality.

Construction DMAIC improvement example – read here
And this is A3 after finishing whole project. Note, there are project results showed in follow up, and analyze section. It is important to share positive things, as well as those, which did not run very well, and need some more attention, or different approach.
And there you are. Filled A3 report after project finalization.

A3 report template
What you will get, by downloading this file:
- A3 form Excel template
- Restaurant example – filled A3 report (above used pictures)

To download entire A3 report template –click on the link below
Do not forget to visit and subscribe my YouTube channel . I am uploading Six Sigma, Lean and Project oriented videos regurarly. So, stay tuned.
Yours sincerely Erik.
Related Post
Visit CI Central | Visit Our Continuous Improvement Store
- [email protected]
- 1-425-939-1604
A3 Thinking
Last updated by Jeff Hajek on February 17, 2024
What is A3 Thinking?
A3 thinking is a philosophical approach to problem solving that centers on a well- communicated team approach to using the PDCA cycle . The tool used to apply this way of thinking is known as the A3 report.
Watch this A3 Thinking Video

A3 Thinking Background
Whether you are a leader or a process owner, a big part of your job will entail problem solving. Taking on problems in a haphazard, random manner is a recipe for inconsistent results. A3 thinking, while not a magic solution to problems, does increase your chances of successfully solving them. The power of the A3 report lies in the structured approach it takes to solving problems.

A3 Thinking is a Structured Form of Problem Solving
Before diving into the A3 report, though, let’s take a look at what a problem is. Essentially, a problem is any situation when “should be” does not match reality.
That gap develops in one of two ways. Either the target gets higher, or performance drops. Regardless of how the gap came to pass, the basic problem-solving system is the same, even though the specific actions taken to close the gap may vary.
Problems with Problem Solving
There are three common failure modes that keep people from effectively solving problems.
- They treat symptoms. Treating just the surface issue leaves the root cause untouched. It will likely pop out sideways, possibly in a worse way.
- They don’t set clear goals . Without a clear end point, it is impossible to know when to stop working. Furthermore, people won’t agree on whether the project was successful or not.
- They don’t build consensus. Most significant problems cross team boundaries. Without support from affected people, problem solving fails.
PDCA (Plan-Do-Check-Act)
At the heart of most effective problem-solving methodologies is the PDCA Cycle (aka the Deming Cycle).
- Plan: Create a solid plan for solving the problem. This should include creating a deep understanding of a problem, identifying the root cause, defining the problem, and setting goals.
- Do: The plan must be implemented.
- Check: Poor problem solvers stop after the “Do” step. Good problem solvers check to see if the solution they put in place really worked.
- Act: When you identify an area where the “Do” step fell short, you must actually fix it.
The A3 Report
The A3 process is a specific, structured method of problem solving. While the A3 report is the visible centerpiece of the process, it is actually more of a result of the process than the actual process itself. The A3 report is simply a concise, communication tool. Because of the recognizable format, individuals can rapidly share ideas and have confidence in what they are talking about.

A3 Thinking Relies on the Use of PDCA
The A3 report gets its name from the “A3” size of paper used in Japan where the report originated. It is relatively close to the size of an 11×17 sheet of paper in the US.
As you continue to read about the A3 report, keep in mind that there is no set format, other than that the sections should follow the PDCA cycle. Templates (such as the ones offered at www.Velaction.com/a3-template/ ) are handy to use as starting points, but feel free to deviate from the precise layout if there is a good reason to do so. One warning, though, if you do make a change: make sure that sufficient space is devoted to the plan step.
A3 Communication
The A3 report is not intended as a tool for independent use. A3 reports involve several people. There should be an owner who is responsible for maintaining the document and managing the problem-solving efforts.
He or she should also have an experienced mentor who can help guide the problem solver through the A3 process. This mentor typically uses a healthy dose of the Socratic Method, pointing the person toward ways to overcome roadblocks rather than actually giving answers. The mentor, in many cases, also lends his authority to the A3 report, so the problem solver acts on the mentor’s behalf in solving the problem. This implies that the mentor needs to have some clout in the organization. Because of the mentor’s support, there is authority strapped to the A3 report. That translates to higher prioritization.
There will also be a variety of stakeholders with a vested interest in the outcome of the A3 project.
Finally, there will be the people involved in data collection, analysis, and, of course, implementing the solutions.
In most organizations, people are busy, and there is a lot coming at them. They have to separate the wheat from the chaff. One of the benefits of the A3 process is that it gets people’s attention. It is generally used for only the most significant problems in the organization, so people tend to take notice when they see the A3 report.
Another big reason that people pay attention to A3 reports is that the somewhat standard format lets them quickly get a handle on what is going on. The A3 report acts as a standardized communication tool. Readers can follow the storyboard and, without much wasted effort, know the background and status of the project.

The A3 Process
A3 thinking takes a systematic approach to problem solving. Typically, a project owner draws up the A3 report with ample support and input from all involved people. The author then runs it by the mentor throughout each step. The feedback and ideas from the discussion are then integrated into the report.
The background section is exactly what it sounds like. It is a brief section that clarifies the problem and adds context. Metrics are often shown in this box.
- Current Conditions
The current conditions section summarizes, not surprisingly, the current situation. It can show an overview of the process, highlight problems, or present anything else that will help people gain understanding of how things are now.
Specific goals should be set. In most cases, goals should have dates associated with them. An A3 report, though, is a storyboard to guide you through a process. At this point, you only know where you want to go, not how long it will take to get there. The goal dates will come out indirectly in the countermeasures step. Once the project is more fully fleshed out, though, you should add dates to the goals.
- Root-Cause Analysis
This step can take a substantial amount of time, as it is the most important one. If the root cause is not clearly identified, you’ll be solving the wrong problem. Mentors should spend significant time reviewing this step to make sure the author has it right.
- Countermeasures
Only when the root cause is understood should an A3 report author start coming up with solutions. For big projects, the countermeasures listed here might have action plans associated with them. Of particular importance is that the projected improvements from the countermeasures should add up to reach the goal.
- Effect Confirmation
It is particularly important that the effects of the countermeasures are confirmed. On occasion, positive but unexpected changes happen. If they were not predicted with the countermeasures, the root cause is likely still present. Go back and try again, or you’ll be starting the whole project over down the road.
- Follow-Up Actions
Follow-up items are not things that have to be done to get a new process up and running. They are intended to capitalize on an opportunity to add further improvement, or to help spread knowledge. In no case should the failure to do a follow-up action item prevent the full implementation of the solution.
Let me stress that point…
The success of a project should not be contingent upon follow-up actions.
If the action item list is never touched, the gains you made should be real, and they should stick. Follow-up items should be focused on going beyond the goals, or simply ‘buttoning down’ loose ends.
Benefits of A3 Thinking
- The consistency of the process supports the mentoring
- The systematic approach and recognizable format promote collaboration.
- The A3 process acts as a hands-on classroom, promoting learning and growth.
- Because of the methodical approach, solutions are more likely to have permanent fixes.
- The A3 report’s format makes it easy to spread gains around the organization.
- The act of assigning a problem-solving owner increases the likelihood of a successful project.
- The economy of language in the A3 report engages people. They know they won’t have to waste time trying to figure out what is going on.
- The collaborative process means more effective decision making.

Words of Warning With A3 Thinking
- No problem is ever truly solved. You can always go further. Some people make a point of avoiding the word “solved” altogether. You don’t need to go to that extreme but do keep in mind that improvement is an ongoing process and you will likely address the same process repeatedly over the years. You’ll identify incremental improvement opportunities, changing customer requirements will demand further improvement, or you’ll be fighting back entropy as outside forces affect your processes.
- While purists advocate handwriting an A3 report, the world is a changing place. Teams are often spread out around the whole globe, and more people than ever are working remotely. In the spirit of continuous improvement , adapt the report to suit your needs. A good technique is to handwrite the section you are working on, and then transfer it to a computer for ease of update, review, and transmission.
- Don’t expect immediate expertise in A3 reports. You’ll need a lot of practice to get good at them.
- Don’t expect immediate expertise in A3 reports. You’ll need a lot of practice to get good at them. (Note that this is intentionally mentioned twice. It is that important.)
- Don’t focus heavily on the report. The A3 thinking process is far more important.
- Use copious graphics on the report. They take far less space than words and are much clearer.
- Make sure targets are specific. Collaboration requires clarity in what people are agreeing to.
- Keep an appropriate scope . The A3 report is not an annual plan. It should be focused on a specific problem. Think “reduce dings on doors”, not “improve quality”.
- Don’t move forward without consensus. If stakeholders are not bought in…
Extended Content for this Section is available at academy.Velaction.com

In an organization that embraces A3 thinking, you will have a big role to play. While you may not be designated as the author or owner of a report, there is a great likelihood that you will see people visiting your work area, scribbling on large sheets of paper.
You will probably be asked many questions and may even be asked to collect data . If you are approached with an A3 report, ask to see it. It will give you a better understanding of how the A3 team leader sees the problem. Chances are you are closer to the process than he or she is and can probably offer some great insight. You may even identify an error that can help prevent your life from being harder down the road.
A3 Thinking and Promotions
If you aspire to move up in your organization, the A3 process is a great way to show what you can do. They tend to be used for important projects and have a good deal of attention paid to them by the decision-makers in the company. Ask your boss for some opportunities to participate in the A3 process.
Tip: Sitting in on a mentor meeting is a good way to gain knowledge about the process a little more quickly.

If you want to be a top performer in a Lean company, make A3 thinking your go-to problem solving methodology for anything that crosses a functional boundary or involves multiple work areas. In addition to helping you develop critical thinking, it hones several other skills that will be invaluable to you.
Many new leaders struggle with talking to senior managers. The A3 report gives them experience in a structured manner. They know what to expect, are working on something positive, and have a chance to be well-prepared for the meeting. It can provide a great opportunity to build a network.
That network building also extends to managers at equal levels. In some companies, leaders are so compartmentalized they seldom get to know their peers as anything more than casual acquaintances. Working together on an A3 report helps build strong relationships.
Communication skills are also refined. Put bluntly, many managers are horrible writers. Grammar aside, it can be a challenge to figure out what a person is saying. Sugar coating abounds. People are reluctant to commit to an idea…

Key Points About A3 Thinking
- A3 thinking is more than just filling out an A3 report. It is a way of training oneself to approach problem solving and leadership in a structured manner.
- A3 thinking is a structured thought process that is based on the PDCA cycle.
- The A3 process is not an individual activity. It requires the effort of the whole team.
Next Steps to Creating an A3 Report
- Determine if your organization has anyone with experience in mentoring others on A3 Thinking. (If you do not have anyone who can help train your organization and need help, contact us at [email protected] .)
- ID a few key people for each A3 mentor to develop.
- Train the team members on the Fundamentals of A3 Thinking .
- Identify basic projects for each individual to lead.
- Complete the projects, meeting periodically to help individuals learn from each other.
- Repeat with increasingly challenging projects.
We offer A3 templates for sale in our online store .
There are a few different sizes available. The templates are created in PowerPoint, so you can modify them to suit your needs.
Remember, though, that there is no set format for the A3 report. Our templates are just intended to be used as a starting point in your problem-solving efforts.
We also offer a free A3 Template, which you can get by clicking the image below.
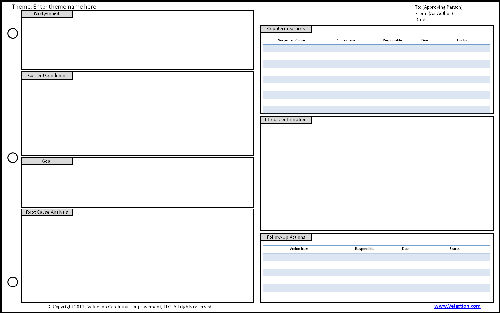
Get this A3 Template Free by Clicking the Image
Leave a Reply Cancel reply
Your email address will not be published. Required fields are marked *
Continuous Improvement Toolkit
Effective Tools for Business and Life!
A3 Problem Solving Template

A3 thinking is a logical and structured approach to problem solving adopted by Lean organizations around the world. It can be used for most kinds of problems and in any part of the business. This A3 template uses a four stages model that is based on the PDCA management philosophy. It makes the problem-solving progress visible to the entire team while allowing the lessons to be learned by others.
This template is a Microsoft Excel spreadsheet that you can use and modify to meet your specific requirements. For example, you may expand the implementation or follow-up plans by increasing the number of rows. The template is available in two variations: a user-friendly straightforward version, and a more detailed one that requires providing in-depth information.
A3 Template (32 KB)
A3 Template – Simple (216 KB)
A3 Template – Detailed (340 KB)
Related Templates

Written by:
CIToolkit Content Team


- Lean Six Sigma
8D Problem Solving Report
8D is a problem solving method used globally, mainly in manufacturing industry by Quality Engineers and Operations managers. The purpose of 8D problem solving method is to identify, correct and prevent problems affecting customers and operational efficiency. It is a problem solving approach similar to PDCA cycle (Plan – Do – Check – Act).
8D stands for 8 Disciplines. It is a methodology that emphasizes “No problem should be repeated but fixed permanently”.
8D Problem Solving Method originally evolved during Second World War. But it became an official methodology in 1974, when it was used by US Government for its Military Operations as ‘Military Standard 1520’. Later it was adapted and popularized by Ford Motors with slight modification in the methodology.
As the name indicates 8D has 8 disciplines that any process or operations should follow to solve the problems occurring. The outcome of 8D is a report called ‘8D Report’ that records the problems, root cause(s) and corrective and preventive actions.
The below are the D’s in 8D approach:

Figure 1: 8D Problem Solving Approach
1D – Team Formation: The first and foremost step not only in 8D but also in any other initiative or project is Team Formation, for any initiative cannot be successful without a right team. The team selected should be committed, competent, co-ordinated, cross-functional with representation from all teams, and should be knowledgeable in 8D methodology.
2D – Problem Description: After selecting the team, our concentration should be on detailing the problem. The team should collect details about the problem, for completely understanding the depth of the problem. All details should be data and fact based.
3D – Interim Containment Actions: Once the problem is described, before heading up to problem solving, the team should fix the effect of the problem, especially on customers. It might involve actions like isolating the items affected, replacing defective parts, before it reaches the customers. This step is mainly to prevent the problem from reaching the market and customers, which might become a competitive disadvantage and reduce customer loyalty.
4D – Root Cause Analysis: After taking containment actions, the team should involve in identifying the root cause(s) for the problem. Methods and tools like 5-Why Analysis , Fishbone diagram , Pareto Analysis , 7 Old QC tools , New QC tools etc. can be used for identifying the root cause. An important point to be noted is: Whatever method is used for RCA , it should be data & fact based.
5D – Formulate Corrective Actions: After successfully arriving at the root cause, the team should formulate corrective actions to be taken to correct the problem. Tools like Brain storming, Affinity diagram etc. can be used.
6D – Validate Corrective Actions: After arriving at the corrective actions, the team should validate whether the solutions are effective. There are several tools like Accelerated life testing , simulation etc. available for this purpose. Then the solution can be implemented in the process. The solution approach from step 4-6 should be repeated until the problem is completely eliminated.
7D – Preventive Action: Identifying and implementing corrective actions is only a temporary solution that keeps the system running or is like ‘Living with the problem by taking counter measures’. The permanent solution is to identify a potential long term solution that will not allow the problem (similar problems) from occurring into the system again. Sometimes corrective action will be a costly, time being measure. Preventive action makes changes in the system, upstream or downstream processes so that the entire system is modified or aligned for ‘Problem Free’ operations.
8D – Team and Individual Recognition: Once the problem is completely solved, the team and the extra-ordinary contributors must be rewarded and recognized appropriately. This will act as a motivation factor for other employees.
These are the steps of 8D methodology. To summarize, 8D is a holistic, systematic and proven methodology for problem solving.
Previous post: Change Management
Next post: Project Portfolio Management
- 10 Things You Should Know About Six Sigma
- Famous Six Sigma People
- Six Sigma Software
Recent Posts
- Control System Expansion
- Energy Audit Management
- Industrial Project Management
- Network Diagram
- Supply Chain and Logistics
- Visual Management
- Utilizing Pareto Charts in Business Analysis
- Privacy Policy
Practical Problem Solving (3C & 5Why)

Next to improving the flow of goods and services in a value stream, Lean also focusses on improving the flow of problems ( Ballé & Ballé, 2012 ). Problems are documented and solved on the team board and escalated to a higher level Team board when the team is not able to solve the problem themselves ( Mann, 2005 ). But how do you really solve a problem? This article describes the practice of root cause analysis and the link between the root cause analysis, team boards and the kaizen loop .
The first step in understanding the problem solving methodology, it is important to understand the 3C METHOD , which is used to document and problems and actions on the Team boards (see illustration 1)

Illustration 1: Example of a 3C template
The 3C ´s stand for Concern, Cause and Countermeasure and encourage employees to think about the definitions of each of these steps. The owner and the date the countermeasure should be implemented are also documented. The Kaizen column is used to evaluate your countermeasure. Is it a fire fighting ´back to standard´ solution or a real preventative ´raise the standard´ solution? If it is a raise the standard solution, the kind of improvements we are looking for within the Lean philosophy, the improvement of the standard should be documented on the kaizen and the kaizen number can be put on the 3C. Finally, the 3C includes a PDCA circle, to be able to track the status of the problem in all stages of problem solving.
Lean puts focus on continuously improving standards, on kaizen, and it is therefore the goal to have as many 3C´s linked to Kaizen as possible. The ratio 3C´s with Kaizen to the 3Cs which are not linked to kaizen are one measure of Lean maturity. To improve this ratio, and improve the number of 3C´s link to kaizen, a root cause analysis is necessary. This is where the 5x Why comes in.
In the following example, which I personally use in trainings and is described in my book Lean Transformations , the use of the 5X WHY to help you find the real root cause of the problem is explained. As a Dutch guy, I like taking my bike to work. As a standard, I defined that my (random) tires should always be filled with air, up to a certain barometric pressure.
- On Monday morning, I plan to take the bike to work, when I realize I have a flat tire. I do a very quick 3C, without analysis, pump up the tire and cycle to work to make sure I do not miss my early morning meeting. This clearly is a quick fix solution, a back to the standard countermeasure.
- On Tuesday morning I want to cycle to work again, but realize the same tire is flat again. Apparently I have not analyzed the problem properly yesterday so today I ask myself why the tire is empty. I find there is a puncture in the tire which needs to be patched. After I patched the tire, I quickly cycle to work. Even though I did more than yesterday, this countermeasure is still a back to standard action.
- On Wednesday morning, my tire is flat for the third time this week. I´m starting to get annoyed but do take the time for a slightly better analysis than yesterday. Why is my tire flat? Because there is a puncture in the tire Why is there a puncture in the tire? Because a piece of glass got stuck into the outside tire. Solution: I remove the glass from the outer tire, patch the puncture, pump up the tire and cycle to work. I would ask the group now, whether I have raised the standard or that the countermeasure was a classical back to standard action. Just like Monday and Tuesday, even though I asked why a couple of times, removing the glass and patching the tire is still a back to standard countermeasure, as I was to find out on Thursday.
- On Thursday morning, I find myself with a flat tire again. This time however, I am motivated to do a real root cause analysis. Why is my tire flat? Because there is a puncture in it Why is there a puncture in my inner tire? Because a nail punctured through it. Why is there something puncturing my tire for the second time this week? The outer tire might not be protective enough to cycle through the rough streets of Hamburg. Solution: invest in new ´unbreakable´ tires over the weekend.
This last solution is the first solution this week that actually describes an improvement of the standard . Monday to Wednesday, I only executed some short term quick fixes to get my bike functioning again. Only on Thursday I found a possible root-cause for my problem, the reason I got ´so many´ flat tires. This led to a proper solution, in this case buying a better tire, to prevent something from puncturing it again.
The 3C´s described in this example, are visualizes in Illustration 2.

Illustration 2: Documented 3Cs, number 4 being the most desirable while it is linked to kaizen. (SOURE: Panneman, 2017 )
Having problems in keeping the standard is just one of the possible types of problems which can be addressed on the Team boards. There are three in total:
- The standard is not good enough (like the flat tire example)
- The standard is not achieved anymore, for instance a KPI that is ´red´
- A team member has identified one of the 8 wastes and would like to address it.
When all teams in an organization solve problems like these on a continuous basis using the root cause analysis, the performance of the organization will improve drastically. When the 3C´s are only used for firefighting, which means the standards are not being raised. There will be no measureable improvement of performance in the long term. A thorough root cause analysis is therefore one of the most important pin points in any (Lean) organization.
Continue to:
Lean Toolbox - Takt-, Cycle-, process- and Lead Time
REFERENCES:
Ballé, F., & Ballé, M. (2012). De Lean Manager - een roman over een Lean Transformatie. Driebergen (NL): Lean Management Instituut. ( summary / order this book )
Mann, D.,2005, Creating a Lean Culture - Tools to sustain Lean Conversions , New York: Productivity Press. ( summary / order this book )
Panneman, T, 2017, Lean Transformations - when and how to climb the four steps of Lean maturity, Maarssen (NL): panview ( summary / Order this book )
Related Articles
5s in practice - sustain, 5s in practice - sweep and standardize, 5s in practice - sort and straighten.

Value Stream Mapping Template

5S Audit Templates

Kaizen Events
I am available for Lean and or Six Sigma trainings via MTS consultingpartner . or contact me via Linkedin .
Publications:

Read the summary here and get your copy here!
Read the summary here , and get your copy here!

Recent Posts
- 01 Six Sigma DMAIC - T.Panneman & D.Stemann (summary)
- 02 Introduction to Six Sigma - What is Standard Deviation?
- 03 Introduction to Six Sigma - Datatypes: Discrete versus Continuous Data
- 04 Influencer - Patterson,K, Grenny,J., McMillan,R., Switzler, A. (summary)
- 05 5S in Practice - Sustain
- 06 5S in Practice - Sweep and Standardize
- 07 5S in Practice - Sort and Straighten
- 08 Bullshit Jobs - D.Graeber (summary)
- 09 Mastering Leadership - R.A.Anderson & W.A.Adams (summary)
- 010 The Culture Code - D.Coyle (summary)
- Change Management
- Training / Coaching
- Lean Transformations
- Personal Growth
- Product overview
- All features
- Latest feature release
- App integrations
- project icon Project management
- Project views
- Custom fields
- Status updates
- goal icon Goals and reporting
- Reporting dashboards
- asana-intelligence icon Asana AI
- workflow icon Workflows and automation
- portfolio icon Resource management
- Capacity planning
- Time tracking
- my-task icon Admin and security
- Admin console
- Permissions
- list icon Personal
- premium icon Starter
- briefcase icon Advanced
- Goal management
- Organizational planning
- Project intake
- Resource planning
- Product launches
- View all uses arrow-right icon

- Work management resources Discover best practices, watch webinars, get insights
- Customer stories See how the world's best organizations drive work innovation with Asana
- Help Center Get lots of tips, tricks, and advice to get the most from Asana
- Asana Academy Sign up for interactive courses and webinars to learn Asana
- Developers Learn more about building apps on the Asana platform
- Community programs Connect with and learn from Asana customers around the world
- Events Find out about upcoming events near you
- Partners Learn more about our partner programs
- Asana for nonprofits Get more information on our nonprofit discount program, and apply.
- Project plans
- Team goals & objectives
- Team continuity
- Meeting agenda
- View all templates arrow-right icon
- Project management |
- What is 8D? A template for efficient pr ...
What is 8D? A template for efficient problem-solving
How you respond when problems arise is one of the most defining qualities of a manager. Luckily, there are tools you can use to master problem-solving. The 8D method of problem-solving combines teamwork and basic statistics to help you reach a logical solution and prevent new issues from arising.
You’ve spent months overseeing the development of your company's newest project. From initiation, planning, and execution, you’re confident this may be your best work yet.
Until the feedback starts rolling in.
There’s no sugar-coating it—things don’t always go as planned. But production or process issues are hardly a signal to throw in the towel. Instead, focus on honing your problem-solving skills to find a solution that keeps it from happening again.
The 8D method of problem solving emphasizes the importance of teamwork to not only solve your process woes but prevent new ones from occurring. In this guide, we’ll break down what 8D is, how to use this methodology, and the benefits it can give to you and your team. Plus, get an 8D template to make solving your issue easier.
What is 8D?
The eight disciplines (8D) method is a problem-solving approach that identifies, corrects, and eliminates recurring problems. By determining the root causes of a problem, managers can use this method to establish a permanent corrective action and prevent recurring issues.
How do you use the 8D method?
The 8D method is a proven strategy for avoiding long-term damage from recurring problems. If you’re noticing issues in your workflow or processes, then it’s a good time to give this problem-solving method a try.
To complete an 8D analysis, follow “the eight disciplines” to construct a statistical analysis of the problem and determine the best solution.
The eight disciplines of problem-solving
8D stands for the eight disciplines you will use to establish an 8D report. As you may notice, this outline starts with zero, which makes nine total disciplines. The “zero stage” was developed later as an initial planning stage.
To illustrate these steps, imagine your organization experienced a decline in team innovation and productivity this past year. Your stakeholders have noticed and want to see changes implemented within the next six months. Below, we’ll use the 8D process to uncover a morale-boosting solution.
![[inline illustration] D8 problem solving approach (infographic)](https://assets.asana.biz/transform/6ab7c188-3258-4d2e-afe6-9a4a084cc09f/inline-productivity-8d-template-1-2x?io=transform:fill,width:2560&format=webp "problem solving report lean")
D0: Prepare and plan
Before starting the problem-solving process, evaluate the problem you want to solve. Understanding the background of the problem will help you identify the root cause in later steps.
Collect information about how the problem has affected a process or product and what the most severe consequences may be. Planning can include:
Gathering data
Determining the prerequisites for solving the problem
Collecting feedback from others involved
![[inline illustration] D0 Planning (example)](https://assets.asana.biz/transform/abc3621d-e1ae-47ff-b731-0ee38cff99e9/inline-productivity-8d-template-2-2x?io=transform:fill,width:2560&format=webp "problem solving report lean")
If we look back at our example, you may want to figure out whether this decline in morale is organization-wide or only applies to a few departments. Consider interviewing a few employees from different departments and levels of management to gain some perspective. Next, determine what knowledge and skills you will need to solve this lapse in productivity.
D1: Form your team
Create a cross-functional team made up of people who have knowledge of the various products and workflows involved. These team members should have the skills needed to solve the problem and put corrective actions in place.
Steps in this discipline may include:
Appointing a team leader
Developing and implementing team guidelines
Determining team goals and priorities
Assigning individual roles
Arranging team-building activities
![[inline illustration] D1 Team members (example)](https://assets.asana.biz/transform/51986017-5150-4dd4-940c-252cd0eb8ba5/inline-productivity-8d-template-3-2x?io=transform:fill,width:2560&format=webp "problem solving report lean")
From our example, a solid team would consist of people with first-hand experience with the issues—like representatives from all departments and key people close to workshop-level work. You may also want to pull someone in from your HR department to help design and implement a solution. Most importantly, make sure the people you choose want to be involved and contribute to the solution.
D2: Identify the problem
You may have a good understanding of your problem by now, but this phase aims to break it down into clear and quantifiable terms by identifying the five W’s a and two H’s (5W2H):
Who first reported the problem?
What is the problem about?
When did it occur and how often?
Where did it occur (relating to the sector, supplier, machine, or production line involved)?
Why is solving the problem important?
How was the problem first detected?
How many parts/units/customers are affected?
![[inline illustration] D2 Problem statement & description (example)](https://assets.asana.biz/transform/9825ecd6-2bd3-4559-a68c-b1ae8aca2e52/inline-productivity-8d-template-4-2x?io=transform:fill,width:2560&format=webp "problem solving report lean")
Use your team’s insights to answer these questions. From our example, your team may conclude that:
Employees feel overwhelmed with their current workload.
There is no real structure or opportunity to share new ideas.
Managers have had no training for meetings or innovation settings.
Disgruntled employees know they can achieve more—and want to achieve more—even if they seem disengaged.
Once you answer these questions, record an official problem statement to describe the issue. If possible, include photos, videos, and diagrams to ensure all parties have a clear understanding of the problem. It may also help to create a flowchart of the process that includes various steps related to the problem description.
D3: Develop an interim containment plan
Much like we can expect speedy first aid after an accident, your team should take immediate actions to ensure you contain the problem—especially if the problem is related to customer safety.
An interim containment plan will provide a temporary solution to isolate the problem from customers and clients while your team works to develop a permanent corrective action. This band-aid will help keep your customers informed and safe—and your reputation intact.
![[inline illustration] D3 Interim containment action (example)](https://assets.asana.biz/transform/d6279c36-ccc6-4de3-89d2-f221632a1059/inline-productivity-8d-template-5-2x?io=transform:fill,width:2560&format=webp "problem solving report lean")
Because your findings revealed workers were overworked and managers lacked training, your team suggests scheduling a few mandatory training sessions for leaders of each department covering time and stress management and combating burnout . You may also want to have a presentation outlining the topics of this training to get key managers and stakeholders interested and primed for positive upcoming changes.
D4: Verify root causes and escape points
Refer back to your findings and consult with your team about how the problem may have occurred. The root cause analysis involves mapping each potential root cause against the problem statement and its related test data. Make sure to test all potential causes—fuzzy brainstorming and sloppy analyses may cause you to overlook vital information.
![[inline illustration] D4 Root cause & escape points (example)](https://assets.asana.biz/transform/301717c6-0434-4c88-addf-d500dc23ae87/inline-productivity-8d-template-6-2x?io=transform:fill,width:2560&format=webp "problem solving report lean")
In our example, focus on the “why” portion of the 5W2H. You and your team identify six root causes:
Managers have never had any training
There is a lack of trust and psychological safety
Employees don’t understand the objectives and goals
Communication is poor
Time management is poor
Employees lack confidence
In addition to identifying the root causes, try to pinpoint where you first detected the problem in the process, and why it went unnoticed. This is called the escape point, and there may be more than one.
D5: Choose permanent corrective actions
Work with your team to determine the most likely solution to remove the root cause of the problem and address the issues with the escape points. Quantitatively confirm that the selected permanent corrective action(s) (PCA) will resolve the problem for the customer.
Steps to choosing a PCA may include:
Determining if you require further expertise
Ensuring the 5W2Hs are defined correctly
Carrying out a decision analysis and risk assessment
Considering alternative measures
Collecting evidence to prove the PCA will be effective
![[inline illustration] D5 Permanent corrective action (example)](https://assets.asana.biz/transform/53509966-18dd-4bb4-88a1-c7ca940fde3f/inline-productivity-8d-template-7-2x?io=transform:fill,width:2560&format=webp "problem solving report lean")
Your team decides to roll out the training used in the interim plan to all employees, with monthly company-wide workshops on improving well-being. You also plan to implement meetings, innovation sessions, and team-coaching training for managers. Lastly, you suggest adopting software to improve communication and collaboration.
D6: Implement your corrective actions
Once all parties have agreed on a solution, the next step is to create an action plan to remove the root causes and escape points. Once the solution is in effect, you can remove your interim containment actions.
After seeing success with the training in the interim phase, your stakeholders approve all of your team’s proposed PCAs. Your representative from HR also plans to implement periodic employee wellness checks to track employee morale .
![[inline illustration] D6 PCA implementation plan (example)](https://assets.asana.biz/transform/ca68af4a-afa7-4be4-93cb-8a8321eb5172/inline-productivity-8d-template-8-2x?io=transform:fill,width:2560&format=webp "problem solving report lean")
To ensure your corrective action was a success, monitor the results, customer, or employee feedback over a long period of time and take note of any negative effects. Setting up “controls” like employee wellness checks will help you validate whether your solution is working or more needs to be done.
D7: Take preventive measures
One of the main benefits of using the 8D method is the improved ability to identify necessary systematic changes to prevent future issues from occurring. Look for ways to improve your management systems, operating methods, and procedures to not only eliminate your current problem, but stop similar problems from developing later on.
![[inline illustration] D7 Preventive measure (example)](https://assets.asana.biz/transform/cdd7b133-fb80-4db7-8935-1285a6b62b69/inline-productivity-8d-template-9-2x?io=transform:fill,width:2560&format=webp "problem solving report lean")
Based on our example, the training your team suggested is now adopted in the new manager onboarding curriculum. Every manager now has a “meeting system” that all meetings must be guided by, and workloads and projects are managed as a team within your new collaboration software . Innovation is improving, and morale is at an all-time high!
D8: Celebrate with your team
The 8D method of problem-solving is impossible to accomplish without dedicated team members and first-class collaboration. Once notes, lessons, research, and test data are documented and saved, congratulate your teammates on a job well done! Make an effort to recognize each individual for their contribution to uncovering a successful solution.
![[inline illustration] 8D Team congratulations & reward (example)](https://assets.asana.biz/transform/d2055965-bf3d-4bf4-a1ea-a0a7c4bf8a32/inline-productivity-8d-template-10-2x?io=transform:fill,width:2560&format=webp "problem solving report lean")
8D report template and example
Check out our 8D report template below to help you record your findings as you navigate through the eight disciplines of problem solving. This is a formal report that can be used as a means of communication within companies, which makes for transparent problem-solving that you can apply to the entire production or process chain.
Benefits of using the 8D method
The 8D method is one of the most popular problem-solving strategies for good reason. Its strength lies in teamwork and fact-based analyses to create a culture of continuous improvement —making it one of the most effective tools for quality managers. The benefits of using the 8D method include:
Improved team-oriented problem-solving skills rather than relying on an individual to provide a solution
Increased familiarity with a problem-solving structure
A better understanding of how to use basic statistical tools for problem-solving
Open and honest communication in problem-solving discussions
Prevent future problems from occurring by identifying system weaknesses and solutions
Improved effectiveness and efficiency at problem-solving
Better collaboration = better problem solving
No matter how good a manager you are, production and process issues are inevitable. It’s how you solve them that separates the good from the great. The 8D method of problem solving allows you to not only solve the problem at hand but improve team collaboration, improve processes, and prevent future issues from arising.
Try Asana’s project management tool to break communication barriers and keep your team on track.
Related resources

Everything you need to know about requirements management

Gartner® Magic Quadrant™ for Adaptive Project Management and Reporting

How Asana drives impactful product launches in 3 steps

Waterfall, Agile, Kanban, and Scrum: What’s the difference?
Thank you for visiting nature.com. You are using a browser version with limited support for CSS. To obtain the best experience, we recommend you use a more up to date browser (or turn off compatibility mode in Internet Explorer). In the meantime, to ensure continued support, we are displaying the site without styles and JavaScript.
- View all journals
- Explore content
- About the journal
- Publish with us
- Sign up for alerts
- Published: 16 September 2024
Multicellular artificial neural network-type architectures demonstrate computational problem solving
- Deepro Bonnerjee 1 , 2 na1 ,
- Saswata Chakraborty 1 , 2 na1 ,
- Biyas Mukherjee 1 , 2 na1 ,
- Ritwika Basu 1 , 2 ,
- Abhishek Paul 1 , 2 &
- Sangram Bagh ORCID: orcid.org/0000-0002-8565-0728 1 , 2
Nature Chemical Biology ( 2024 ) Cite this article
Metrics details
- Biophysical chemistry
- Synthetic biology
Here, we report a modular multicellular system created by mixing and matching discrete engineered bacterial cells. This system can be designed to solve multiple computational decision problems. The modular system is based on a set of engineered bacteria that are modeled as an ‘artificial neurosynapse’ that, in a coculture, formed a single-layer artificial neural network-type architecture that can perform computational tasks. As a demonstration, we constructed devices that function as a full subtractor and a full adder. The system is also capable of solving problems such as determining if a number between 0 and 9 is a prime number and if a letter between A and L is a vowel. Finally, we built a system that determines the maximum number of pieces of a pie that can be made for a given number of straight cuts. This work may have importance in biocomputer technology development and multicellular synthetic biology.

This is a preview of subscription content, access via your institution
Access options
Access Nature and 54 other Nature Portfolio journals
Get Nature+, our best-value online-access subscription
$29.99 / 30 days
cancel any time
Subscribe to this journal
Receive 12 print issues and online access
$259.00 per year
only $21.58 per issue
Buy this article
- Purchase on SpringerLink
- Instant access to full article PDF
Prices may be subject to local taxes which are calculated during checkout

Data availability
All relevant data supporting the findings are available within the paper, Extended Data figures and the Supplementary Data. Source data are provided with this paper.
Benenson, Y. Biomolecular computing systems: principles, progress and potential. Nat. Rev. Genet. 13 , 455–468 (2012).
Article CAS PubMed Google Scholar
Reif, J. H., Hauser, M., Pirrung, M. & LaBean, T. in Complex Systems Science in Biomedicine (eds. Deisboeck, T. S. & Kresh, J. Y.) 701–735 (Springer, 2006).
Ma, Q. et al. DNA computing: principle, construction, and applications in intelligent diagnostic. Small Struct. 2 , 2100051 (2021).
Article CAS Google Scholar
Yoon, J., Lim, J., Shin, M., Lee, T. & Choi, J. W. Toward bioelectronic device based on bionanohybrid composed of nanomaterials and biomaterials: from nucleic acid and protein to living cell. Appl. Phys. Rev. 10 , 011302 (2023).
Fan, D., Wang, J., Wang, E. & Dong, S. Propelling DNA computing with materials’ power: recent advancements in innovative DNA logic computing systems and smart bio‐applications. Adv. Sci. 7 , 2001766 (2020).
Lin, K. N., Volkel, K., Tuck, J. M. & Keung, A. J. Dynamic and scalable DNA-based information storage. Nat. Commun. 11 , 2981 (2020).
Article CAS PubMed PubMed Central Google Scholar
Lederman, H., Macdonald, J., Stefanovic, D. & Stojanovic, M. N. Deoxyribozyme-based three-input logic gates and construction of a molecular full adder. Biochemistry 45 , 1194–1199 (2006).
Fratto, B. E., Lewer, J. M. & Katz, E. An enzyme based half-adder and half-subtractor with a modular design. ChemPhysChem 17 , 2210–2217 (2016).
Cherry, K. M. & Qian, L. Scaling up molecular pattern recognition with DNA-based winner-take-all neural networks. Nature 559 , 370–376 (2018).
Adleman, L. M. Molecular computation of solutions to combinatorial problems. Science 266 , 1021–1024 (1994).
Faulhammer, D., Cukras, A. R., Lipton, R. J. & Landweber, L. F. Molecular computation: RNA solutions to chess problems. Proc. Natl Acad. Sci. USA 97 , 1385–1389 (2000).
Chao, J. et al. Solving mazes with single-molecule DNA navigators. Nat. Mater. 18 , 273–279 (2018).
Article PubMed Google Scholar
Brophy, J. A. N. & Voigt, C. A. Principles of genetic circuit design. Nat. Methods 11 , 508–520 (2014).
Bonnet, J., Yin, P., Ortiz, M. E., Subsoontorn, P. & Endy, D. Amplifying genetic logic gates. Science 340 , 599–603 (2013).
Bonnerjee, D., Mukhopadhyay, S. & Bagh, S. Design, fabrication, and device chemistry of a 3-input-3-output synthetic genetic combinatorial logic circuit with a 3-input AND gate in a single bacterial cell. Bioconjug. Chem. 30 , 3013–3020 (2019).
Can, U. I., Nagarajan, N., Vural, D. C. & Zorlutuna, P. Muscle-cell-based ‘living diodes’. Adv. Biosyst. 1 , 1600035 (2017).
Article Google Scholar
Wong, A., Wang, H., Poh, C. L. & Kitney, R. I. Layering genetic circuits to build a single cell, bacterial half adder. BMC Biol. 13 , 40 (2015).
Article PubMed PubMed Central Google Scholar
Friedland, A. E. et al. Synthetic gene networks that count. Science 324 , 1199–1202 (2009).
Sexton, J. T. & Tabor, J. J. Multiplexing cell–cell communication. Mol. Syst. Biol. 16 , e9618 (2020).
Ausländer, D. et al. Programmable full-adder computations in communicating three-dimensional cell cultures. Nat. Methods 15 , 57–60 (2018).
Weinberg, B. et al. Large-scale design of robust genetic circuits with multiple inputs and outputs for mammalian cells. Nat. Biotechnol. 35 , 453–462 (2017).
Müller, M. et al. Designed cell consortia as fragrance-programmable analog-to-digital converters. Nat. Chem. Biol. 13 , 309–316 (2017).
Kim, M., Julius, A. A. & Cheang U. K. Microbiorobotics: Biologically Inspired Microscale Robotic Systems 2nd edn (Elsevier, 2017)
Justus, K. B. et al. A biosensing soft robot: autonomous parsing of chemical signals through integrated organic and inorganic interfaces. Sci. Robot. 4 , eaax0765 (2019).
Grozinger, L. et al. Pathways to cellular supremacy in biocomputing. Nat. Commun. 10 , 5250 (2019).
Chen, Y. Y. & Smolke, C. D. From DNA to targeted therapeutics: bringing synthetic biology to the clinic. Sci. Transl. Med. 3 , 106ps42 (2011).
Yan, X., Liu, X., Zhao, C. & Chen, G. Q. Applications of synthetic biology in medical and pharmaceutical fields. Signal Transduct. Target. Ther. 8 , 199 (2023).
Johnson, M. B., March, A. R. & Morsut, L. Engineering multicellular systems: using synthetic biology to control tissue self-organization. Curr. Opin. Biomed. Eng. 4 , 163–173 (2017).
Teravest, M. A., Li, Z. & Angenent, L. T. Bacteria-based biocomputing with cellular computing circuits to sense, decide, signal, and act. Energy Environ. Sci. 4 , 4907–4916 (2011).
Dvořák, P., Nikel, P. I., Damborský, J. & de Lorenzo, V. Bioremediation 3.0: engineering pollutant-removing bacteria in the times of systemic biology. Biotechnol. Adv. 35 , 845–866 (2017).
Gilbert, C. & Ellis, T. Biological engineered living materials: growing functional materials with genetically programmable properties. ACS Synth. Biol. 8 , 1–15 (2019).
Sarkar, K., Chakraborty, S., Bonnerjee, D. & Bagh, S. Distributed computing with engineered bacteria and its application in solving chemically generated 2 × 2 maze problems. ACS Synth. Biol. 10 , 2456–2464 (2021).
Collins, J. Synthetic biology: bits and pieces come to life. Nature 483 , S8–S10 (2012).
Ren, X. et al. Cardiac muscle cell-based coupled oscillator network for collective computing. Adv. Intell. Syst. 3 , 2000253 (2021).
Ji, J. et al. Large-scale cardiac muscle cell-based coupled oscillator network for vertex coloring problem. Adv. Intell. Syst. 5 , 2200356 (2023).
Sarkar, K., Bonnerjee, D., Srivastava, R. & Bagh, S. A single layer artificial neural network type architecture with molecular engineered bacteria for reversible and irreversible computing. Chem. Sci. 12 , 15821–15832 (2021).
Srivastava, R. & Bagh, S. A logically reversible double Feynman gate with molecular engineered bacteria arranged in an artificial neural network-type architecture. ACS Synth. Biol. 12 , 51–60 (2023).
Rizik, L., Danial, L., Habib, M., Weiss, R. & Daniel, R. Synthetic neuromorphic computing in living cells. Nat. Commun. 13 , 5602 (2022).
Millacura, F. A., Largey, B. & French, C. E. ParAlleL: a novel population-based approach to biological logic gates. Front. Bioeng. Biotechnol. 7 , 46 (2019).
Demuth, H. & De Jesús, B. Neural Network Design 2nd edn (Martin Hagan, 2014).
Sarkar, K., Mukhopadhyay, S., Bonnerjee, D., Srivastava, R. & Bagh, S. A frame-shifted gene, which rescued its function by non-natural start codons and its application in constructing synthetic gene circuits. J. Biol. Eng. 13 , 20 (2019).
Lutz, R. & Bujard, H. Independent and tight regulation of transcriptional units in Escherichia coli via the LacR/O, the TetR/O and AraC/I 1-I 2 regulatory elements. Nucleic Acids Res. 25 , 1203–1210 (1997).
Goldreich, O. Computational Complexity: A Conceptual Perspective (Cambridge Univ. Press, 2008).
Mezard, M. & Montanari, A. Information, Physics and Computation (Oxford Graduate Texts, Oxford Univ. Press, 2009).
Baldwin, C. Y. & Clark, K. B. in Complex Engineered Systems (eds. Braha, D. et al.) 175–205 (Springer, 2006).
Glykofrydis, F. & Elfick, A. Exploring standards for multicellular mammalian synthetic biology. Trends Biotechnol. 40 , 1299–1312 (2022).
Boo, A., Amaro, R. L. & Stan, G. B. Quorum sensing in synthetic biology: a review. Curr. Opin. Syst. Biol. 28 , 100378 (2021).
Ohlendorf, R., Vidavski, R. R., Eldar, A., Moffat, K. & Möglich, A. From dusk till dawn: one-plasmid systems for light-regulated gene expression. J. Mol. Biol. 416 , 534–542 (2012).
Multamäki, E. et al. Optogenetic control of bacterial expression by red light. ACS Synth. Biol. 11 , 3354–3367 (2022).
Macia, J., Vidiella, B. & Solé, R. V. Synthetic associative learning in engineered multicellular consortia. J. R. Soc. Interface 14 , 20170158 (2017).
Moškon, M., Pušnik, Ž., Zimic, N. & Mraz, M. Field-programmable biological circuits and configurable (bio)logic blocks for distributed biological computing. Comput. Biol. Med. 128 , 104109 (2021).
Beal, J. et al. The long journey towards standards for engineering biosystems. EMBO Rep. 21 , e50521 (2020).
Toda, S., Blauch, L. R., Tang, S. K. Y., Morsut, L. & Lim, W. A. Programming self-organizing multicellular structures with synthetic cell–cell signaling. Science 361 , 156–162 (2018).
Aydin, O. et al. Principles for the design of multicellular engineered living systems. APL Bioeng. 6 , 010903 (2022).
Mukhopadhyay, S., Sarkar, K., Srivastava, R., Pal, A. & Bagh, S. Processing two environmental chemical signals with a synthetic genetic IMPLY gate, a 2-input-2-output integrated logic circuit, and a process pipeline to optimize its systems chemistry in Escherichia coli . Biotechnol. Bioeng. 117 , 1502–1512 (2020).
Salis, H. M., Mirsky, E. A. & Voigt, C. A. Automated design of synthetic ribosome binding sites to control protein expression. Nat. Biotechnol. 27 , 946–950 (2009).
Download references
Acknowledgements
This work was financially supported by grant RSI4002, Department of Atomic Energy, Government of India, awarded to Saha Institute of Nuclear Physics, and S.B. is a part of it.
Author information
These authors contributed equally: Deepro Bonnerjee, Saswata Chakraborty, Biyas Mukherjee.
Authors and Affiliations
Biophysics and Structural Genomics Division, Saha Institute of Nuclear Physics, Block AF, Sector-I, Bidhannagar, Kolkata, India
Deepro Bonnerjee, Saswata Chakraborty, Biyas Mukherjee, Ritwika Basu, Abhishek Paul & Sangram Bagh
Homi Bhabha National Institute, Training School Complex, Anushaktinagar, Mumbai, India
You can also search for this author in PubMed Google Scholar
Contributions
D.B., S.C., B.M., R.B. and A.P. performed all the experiments. D.B., S.C., B.M., R.B. and S.B. analyzed the data. D.B., S.C. and S.B. designed the experiments and wrote the manuscript. S.B. designed and conceived the study.
Corresponding author
Correspondence to Sangram Bagh .
Ethics declarations
Competing interests.
The authors declare no competing interests.
Peer review
Peer review information.
Nature Chemical Biology thanks Allen Liu, Pinar Zorlutuna and the other, anonymous, reviewer(s) for their contribution to the peer review of this work.
Additional information
Publisher’s note Springer Nature remains neutral with regard to jurisdictional claims in published maps and institutional affiliations.
Extended data
Extended data fig. 1 genetic circuit designs..
Generic maps of the synthetic genetic networks that encode corresponding specific functions to each bactoneuron type.
Extended Data Fig. 2 Details of characterization and Dose Responses experiments of Bactoneurons that went through no iteration and were selected as final.
The bactoneurons AS1, AS2, AS3, AS4, AS8 and AS9 were separately subjected to all possible combinations of input conditions (saturated concentration ‘1’ or absent ‘0’) yielding corresponding parameter values of Fold Change (F.C.), Σ Leakage (ΣL) and Signal variation (S.V.) (shown in figure). ‘Signal variation’ (S.V.) is a comparative parameter drawn by scaling the fluorescence signal (@ ‘ON’ state) of all bactoneurons in an iteration set (with the same output channel) by considering the strongest signal of all bactoneurons as ‘1’. For Dose response, the concentration of one parameter was varied across various concentration points while the other two inducers were kept constant at ‘0’ for repressor or saturated concentration for activator (specified atop each dose response curve). The fluorescence readings obtained from the dose response experiments were fitted with the Log-Sigmoid function (see Methods ) to derive the parameters Bias (B AS# ) and Weights (W inducer ) and the respective Inducer Saturation points (Sat.) were identified. Each data point represent mean and s.d. from four independent colonies.
Source data
Extended data fig. 3 details of characterization and dose responses experiments across iterations of bactoneuron 5..
AS5A, AS5B, AS5C, AS5D, AS5E, AS5F and AS5G; yielding corresponding parameter values (shown in figure) of Fold Change (F.C.), Σ Leakage (ΣL), Signal variation (S.V.), Bias (B AS# ), Weights (W inducer) and Inducer Saturation points (Sat.). The fluorescence readings obtained from the dose response experiments were fitted with the Log-Sigmoid function (see Methods ) to derive the Weight and Bias parameters. The induction states of the two constant inducers are specified atop the fitted curves. The final selected Construct is shown boxed. Each data point represent mean and s.d. from four independent colonies.
Extended Data Fig. 4 Details of characterization and Dose Responses experiments across iterations of Bactoneuron 6.
AS6A, AS6B, AS6C, AS6D, AS6E and AS6F; yielding corresponding parameter values (shown in figure) of Fold Change (F.C.), Σ Leakage (ΣL), Signal variation (S.V.), Bias (B AS# ), Weights (W Inducer) and Inducer Saturation points (Sat.). The fluorescence readings obtained from the dose response experiments were fitted with the Log-Sigmoid function (see Methods ) to derive the Weight and Bias parameters. The induction states of the two constant inducers are specified atop the fitted curves. The final selected Construct is shown boxed. Each data point represent mean and s.d. from four independent colonies.
Extended Data Fig. 5 Details of characterization and Dose Responses experiments across iterations of Bactoneuron 7.
AS7A, AS7B, AS7C and AS7D; yielding corresponding parameter values (shown in figure) of Fold Change (F.C.), Σ Leakage (ΣL), Signal variation (S.V.), Bias (B AS# ), Weights (W Inducer) and Inducer Saturation points (Sat.). The fluorescence readings obtained from the dose response experiments were fitted with the Log-Sigmoid function (see Methods ) to derive the Weight and Bias parameters. The induction states of the two constant inducers are specified atop the fitted curves. The final selected Construct is shown boxed. Each data point represent mean and s.d. from four independent colonies.
Extended Data Fig. 6 Detailed genetic circuit designs and plasmid maps of Bactoneurons that went through no iteration and were selected as final.
( a ) BNeu AS1, ( b ) BNeu AS2, ( c ) BNeu AS3, ( d ) BNeu AS4, ( e ) BNeu AS8, ( f ) BNeu AS9. Names of plasmids constructed and incorporated in the circuits are also shown within the plasmid schematic. MCS represents empty network brick cloning site. ‘F’ and ‘B’ denotes forward and reverse direction of cassette respectively. The E2-crimson output of AS1 is altered with EGFP to give AS1* and EGFP output of AS2 is altered with E2-Crimson to give AS2*.
Extended Data Fig. 7 Detailed genetic circuit designs and plasmid maps of Bactoneuron 5 across iterations.
( a ) BNeu AS5A, ( b ) BNeu AS5B, ( c ) BNeu AS5C, ( d ) BNeu AS5D, ( e ) BNeu AS5E, ( f ) BNeu AS5F and ( g ) BNeu AS5G. Names of plasmids constructed and incorporated in the circuits are also shown within the plasmid schematic. MCS represents empty network brick cloning site. ‘F’ and ‘B’ denotes forward and reverse direction of cassette respectively.
Extended Data Fig. 8 Detailed genetic circuit designs and plasmid maps of Bactoneuron 6 and Bactoneuron 7 across iterations.
( a ) BNeu AS6A, ( b ) BNeu AS6B, ( c ) BNeu AS6C, ( d ) BNeu AS6D, ( e ) BNeu AS6E, ( f ) BNeu AS6F, ( g ) BNeu AS7A, ( h ) BNeu AS7B, ( i ) BNeu AS7C and ( j ) BNeu AS7D. Names of plasmids constructed and incorporated in the circuits are also shown within the plasmid schematic. MCS represents empty network brick cloning site. ‘F’ and ‘B’ denotes forward and reverse direction of cassette respectively.
Extended Data Fig. 9 Detailed genetic circuit designs and plasmid maps of Bactoneurons.
( a ) BNeu AS10, ( b ) BNeu AS11 and AS11*, ( c ) BNeu AS12, ( d ) BNeu AS13, ( e ) BNeu AS14 and AS14*. Names of plasmids constructed and incorporated in the circuits are also shown within the plasmid schematic. MCS represents empty network brick cloning site. ‘F’ and ‘B’ denotes forward and reverse direction of cassette respectively. The EGFP output of AS11 is altered with mTagBFP2 to give AS11* and EGFP output of AS14 is altered with mKO2 to give AS14*.
Extended Data Fig. 10 Experimental Characterizations of Bactoneurons.
Fold change characterization, Dose Responses experiments with fitting values, simulation, and re-validation of Bactoneurons AS10, AS11, AS12, AS13, and AS14. Each data point represent mean and s.d. from four independent colonies.
Supplementary information
Supplementary information.
Supplementary Fig. 1 and Tables 1–5.
Reporting Summary
Source data fig. 2.
Statistical source data for threshold parameters obtained from Extended Data Figs. 2 – 5 .
Source Data Fig. 3
Statistical source data for simulation and validation of bactoneurons.
Source Data Extended Data Fig. 2
Statistical source data for characterization and dose–response of bactoneurons.
Source Data Extended Data Fig. 3
Source data extended data fig. 4, source data extended data fig. 5, source data extended data fig. 10.
Statistical source data for characterization, dose–response, simulation and experimental validation of bactoneurons.
Rights and permissions
Springer Nature or its licensor (e.g. a society or other partner) holds exclusive rights to this article under a publishing agreement with the author(s) or other rightsholder(s); author self-archiving of the accepted manuscript version of this article is solely governed by the terms of such publishing agreement and applicable law.
Reprints and permissions
About this article
Cite this article.
Bonnerjee, D., Chakraborty, S., Mukherjee, B. et al. Multicellular artificial neural network-type architectures demonstrate computational problem solving. Nat Chem Biol (2024). https://doi.org/10.1038/s41589-024-01711-4
Download citation
Received : 23 June 2023
Accepted : 26 July 2024
Published : 16 September 2024
DOI : https://doi.org/10.1038/s41589-024-01711-4
Share this article
Anyone you share the following link with will be able to read this content:
Sorry, a shareable link is not currently available for this article.
Provided by the Springer Nature SharedIt content-sharing initiative
Quick links
- Explore articles by subject
- Guide to authors
- Editorial policies
Sign up for the Nature Briefing newsletter — what matters in science, free to your inbox daily.

Guide: Problem Solving

Author: Daniel Croft
Daniel Croft is an experienced continuous improvement manager with a Lean Six Sigma Black Belt and a Bachelor's degree in Business Management. With more than ten years of experience applying his skills across various industries, Daniel specializes in optimizing processes and improving efficiency. His approach combines practical experience with a deep understanding of business fundamentals to drive meaningful change.
Problem-solving stands as a fundamental skill, crucial in navigating the complexities of both everyday life and professional environments. Far from merely providing quick fixes, it entails a comprehensive process involving the identification, analysis, and resolution of issues.
This multifaceted approach requires an understanding of the problem’s nature, the exploration of its various components, and the development of effective solutions. At its core, problem-solving serves as a bridge from the current situation to a desired outcome, requiring not only the recognition of an existing gap but also the precise definition and thorough analysis of the problem to find viable solutions.
What is Problem Solving?

At its core, problem-solving is about bridging the gap between the current situation and the desired outcome. It starts with recognizing that a discrepancy exists, which requires intervention to correct or improve. The ability to identify a problem is the first step, but it’s equally crucial to define it accurately. A well-defined problem is half-solved, as the saying goes.
Analyzing the problem is the next critical step. This analysis involves breaking down the problem into smaller parts to understand its intricacies. It requires looking at the problem from various angles and considering all relevant factors – be they environmental, social, technical, or economic. This comprehensive analysis aids in developing a deeper understanding of the problem’s root causes, rather than just its symptoms.

Finally, effective problem-solving involves the implementation of the chosen solution and its subsequent evaluation. This stage tests the practicality of the solution and its effectiveness in the real world. It’s a critical phase where theoretical solutions meet practical application.
The Nature of Problems
The nature of the problem significantly influences the approach to solving it. Problems vary greatly in their complexity and structure, and understanding this is crucial for effective problem-solving.
Simple vs. Complex Problems : Simple problems are straightforward, often with clear solutions. They usually have a limited number of variables and predictable outcomes. On the other hand, complex problems are multi-faceted. They involve multiple variables, stakeholders, and potential outcomes, often requiring a more sophisticated analysis and a multi-pronged approach to solving.
Structured vs. Unstructured Problems : Structured problems are well-defined. They follow a specific pattern or set of rules, making their outcomes more predictable. These problems often have established methodologies for solving. For example, mathematical problems usually fall into this category. Unstructured problems, in contrast, are more ambiguous. They lack a clear pattern or set of rules, making their outcomes uncertain. These problems require a more exploratory approach, often involving trial and error, to identify potential solutions.
Understanding the type of problem at hand is essential, as it dictates the approach. For instance, a simple problem might require a straightforward solution, while a complex problem might need a more comprehensive, step-by-step approach. Similarly, structured problems might benefit from established methodologies, whereas unstructured problems might need more innovative and creative problem-solving techniques.
The Problem-Solving Process
The process of problem-solving is a methodical approach that involves several distinct stages. Each stage plays a crucial role in navigating from the initial recognition of a problem to its final resolution. Let’s explore each of these stages in detail.
Step 1: Identifying the Problem

Step 2: Defining the Problem
Once the problem is identified, the next step is to define it clearly and precisely. This is a critical phase because a well-defined problem often suggests its solution. Defining the problem involves breaking it down into smaller, more manageable parts. It also includes understanding the scope and impact of the problem. A clear definition helps in focusing efforts and resources efficiently and serves as a guide to stay on track during the problem-solving process.
Step 3: Analyzing the Problem

Step 4: Generating Solutions

Step 5: Evaluating and Selecting Solutions
After generating a list of possible solutions, the next step is to evaluate each one critically. This evaluation includes considering the feasibility, costs, benefits, and potential impact of each solution. Techniques like cost-benefit analysis, risk assessment, and scenario planning can be useful here. The aim is to select the solution that best addresses the problem in the most efficient and effective way, considering the available resources and constraints.
Step 6: Implementing the Solution

Step 7: Reviewing and Reflecting
The final stage in the problem-solving process is to review the implemented solution and reflect on its effectiveness and the process as a whole. This involves assessing whether the solution met its intended goals and what could have been done differently. Reflection is a critical part of learning and improvement. It helps in understanding what worked well and what didn’t, providing valuable insights for future problem-solving efforts.

Tools and Techniques for Effective Problem Solving
Problem-solving is a multifaceted endeavor that requires a variety of tools and techniques to navigate effectively. Different stages of the problem-solving process can benefit from specific strategies, enhancing the efficiency and effectiveness of the solutions developed. Here’s a detailed look at some key tools and techniques:
Brainstorming

SWOT Analysis (Strengths, Weaknesses, Opportunities, Threats)

Root Cause Analysis
This is a method used to identify the underlying causes of a problem, rather than just addressing its symptoms. One popular technique within root cause analysis is the “ 5 Whys ” method. This involves asking “why” multiple times (traditionally five) until the fundamental cause of the problem is uncovered. This technique encourages deeper thinking and can reveal connections that aren’t immediately obvious. By addressing the root cause, solutions are more likely to be effective and long-lasting.

Mind Mapping

Each of these tools and techniques can be adapted to different types of problems and situations. Effective problem solvers often use a combination of these methods, depending on the nature of the problem and the context in which it exists. By leveraging these tools, one can enhance their ability to dissect complex problems, generate creative solutions, and implement effective strategies to address challenges.
Developing Problem-Solving Skills
Developing problem-solving skills is a dynamic process that hinges on both practice and introspection. Engaging with a diverse array of problems enhances one’s ability to adapt and apply different strategies. This exposure is crucial as it allows individuals to encounter various scenarios, ranging from straightforward to complex, each requiring a unique approach. Collaborating with others in teams is especially beneficial. It broadens one’s perspective, offering insights into different ways of thinking and approaching problems. Such collaboration fosters a deeper understanding of how diverse viewpoints can contribute to more robust solutions.
Reflection is equally important in the development of problem-solving skills. Reflecting on both successes and failures provides valuable lessons. Successes reinforce effective strategies and boost confidence, while failures are rich learning opportunities that highlight areas for improvement. This reflective practice enables one to understand what worked, what didn’t, and why.
Critical thinking is a foundational skill in problem-solving. It involves analyzing information, evaluating different perspectives, and making reasoned judgments. Creativity is another vital component. It pushes the boundaries of conventional thinking and leads to innovative solutions. Effective communication also plays a crucial role, as it ensures that ideas are clearly understood and collaboratively refined.
In conclusion, problem-solving is an indispensable skill set that blends analytical thinking, creativity, and practical implementation. It’s a journey from understanding the problem to applying a solution and learning from the outcome.
Whether dealing with simple or complex issues, or structured or unstructured challenges, the essence of problem-solving lies in a methodical approach and the effective use of various tools and techniques. It’s a skill that is honed over time, through experience, reflection, and the continuous development of critical thinking, creativity, and communication abilities. In mastering problem-solving, one not only addresses immediate issues but also builds a foundation for future challenges, leading to more innovative and effective outcomes.
- Mourtos, N.J., Okamoto, N.D. and Rhee, J., 2004, February. Defining, teaching, and assessing problem solving skills . In 7th UICEE Annual Conference on Engineering Education (pp. 1-5).
- Foshay, R. and Kirkley, J., 2003. Principles for teaching problem solving. Technical paper , 4 (1), pp.1-16.
Q: What are the key steps in the problem-solving process?
A : The problem-solving process involves several key steps: identifying the problem, defining it clearly, analyzing it to understand its root causes, generating a range of potential solutions, evaluating and selecting the most viable solution, implementing the chosen solution, and finally, reviewing and reflecting on the effectiveness of the solution and the process used to arrive at it.
Q: How can brainstorming be effectively used in problem-solving?
A: Brainstorming is effective in the solution generation phase of problem-solving. It involves gathering a group and encouraging the free flow of ideas without immediate criticism. The goal is to produce a large quantity of ideas, fostering creative thinking. This technique helps in uncovering unique and innovative solutions that might not surface in a more structured setting.
Q: What is SWOT Analysis and how does it aid in problem-solving?
A : SWOT Analysis is a strategic planning tool used to evaluate the Strengths, Weaknesses, Opportunities, and Threats involved in a situation. In problem-solving, it aids by providing a clear understanding of the internal and external factors that could impact the problem and potential solutions. This analysis helps in formulating strategies that leverage strengths and opportunities while mitigating weaknesses and threats.
Q: Why is it important to understand the nature of a problem before solving it?
A : Understanding the nature of a problem is crucial as it dictates the approach for solving it. Problems can be simple or complex, structured or unstructured, and each type requires a different strategy. A clear understanding of the problem’s nature helps in applying the appropriate methods and tools for effective resolution.
Q: How does reflection contribute to developing problem-solving skills?
A : Reflection is a critical component in developing problem-solving skills. It involves looking back at the problem-solving process and the implemented solution to assess what worked well and what didn’t. Reflecting on both successes and failures provides valuable insights and lessons, helping to refine and improve problem-solving strategies for future challenges. This reflective practice enhances one’s ability to approach problems more effectively over time.

Daniel Croft
Hi im Daniel continuous improvement manager with a Black Belt in Lean Six Sigma and over 10 years of real-world experience across a range sectors, I have a passion for optimizing processes and creating a culture of efficiency. I wanted to create Learn Lean Siigma to be a platform dedicated to Lean Six Sigma and process improvement insights and provide all the guides, tools, techniques and templates I looked for in one place as someone new to the world of Lean Six Sigma and Continuous improvement.

Free Lean Six Sigma Templates
Improve your Lean Six Sigma projects with our free templates. They're designed to make implementation and management easier, helping you achieve better results.
Was this helpful?
COMMENTS
A3 Report An A3 Report is a Toyota-pioneered practice of getting the problem, the analysis, the corrective actions, and the action plan down on a single sheet of large (A3) paper, often with the use of graphics. At Toyota, A3 reports have evolved into a standard method for summarizing problem-solving exercises, status reports, and planning exercises like value-stream mapping.
A3 Problem solving is a structured and systematic approach to problem-solving that originated with the lean manufacturing methodology. It visualizes the problem-solving process using a one-page document known as an A3 report. The A3 report provides an overview of the problem, data analysis, root causes, solutions, and results in a clear and concise manner.
A3 structured problem solving is a Lean Six Sigma methodology that has been designed and developed to support continuous improvement and solve complex business problems in a logical and structured process. The guide will give you a full understanding of what A3 Problem solving is and a breakdown of all the steps of how to apply it within your ...
The A3 problem-solving template is a one-page report format originally developed by Toyota, a company well-known for its lean thinking. The design of the ledger size paper encourages concise communication and collaboration among team members, as it requires the problem definition, root cause analysis, countermeasures, and follow-up plan to fit ...
An A3 is a one-page report prepared on a single 11 x 17 sheet of paper that adheres to the discipline of PDCA thinking as applied to collaborative problem solving, strategy development or reporting. The A3 includes the background, problem statement, analysis, proposed actions, and the expected results.
The A3 problem-solving approach is a powerful tool used to identify, analyse and solve issues. This comprehensive guide dives deep into the methodology, outlining the A3 problem-solving template and how to use it to unlock improvements and gain deeper insights into various situations.
When starting an A3 problem-solving initiative, you should consider the blank A3 merely as a guide leading you through the problem-solving process, one "box," or step, at a time. But at each stage, you must first think about and investigate the problem situation and only then record your thinking. However, do not expect to complete the ...
What is A3 problem solving report? On a literal level, A3 refers to a paper size 29.7 x 42.0 in cm 11×17 in inches. In the lean six sigma world, we use this report out tool to show teams thinking, when addressing project goal. Use A3 during whole project life cycle. Create A3 right after project charter creation.
A3 reports have become one of the most popular lean tools today, a way for people and teams to work together to solve problems; and their widespread adoption could easily be viewed in lean terms as…a problem. Tools often provide traction for getting started with lean practice, and A3s often deliver immediate results.
The A3 Project Report tool is ideal for systematically structuring and standardizing your problem-solving process. This free template aims to assist you in tackling workplace problems. The A3 template is based on the A3 problem-solving method, which is a popular method for continuous improvement in Lean and Six Sigma methodologies.
A3 Thinking is a great way to communicate and manage problem solving efforts. Read the extended article and get a free A3 Template.
A3 problem solving is a problem-solving approach that distills a problem onto a piece of paper commonly used in Lean and Six Sigma methodologies.
A3 thinking is a logical and structured approach to problem solving adopted by Lean organizations around the world. It can be used for most kinds of problems and in any part of the business. This A3 template uses a four stages model that is based on the PDCA management philosophy. It makes the problem-solving progress visible to the entire team while allowing the lessons to be learned by others.
The A3 problem solving technique is a visual, team-based problem-solving approach that is frequently used in Lean Six Sigma projects. The A3 report is a one-page document that clearly and concisely outlines the problem, root cause analysis, and proposed solution.
8D Problem Solving Report 8D is a problem solving method used globally, mainly in manufacturing industry by Quality Engineers and Operations managers. The purpose of 8D problem solving method is to identify, correct and prevent problems affecting customers and operational efficiency. It is a problem solving approach similar to PDCA cycle (Plan - Do - Check - Act).
Practical Problem Solving (3C & 5Why) Next to improving the flow of goods and services in a value stream, Lean also focusses on improving the flow of problems (Ballé & Ballé, 2012). Problems are documented and solved on the team board and escalated to a higher level Team board when the team is not able to solve the problem themselves (Mann ...
Learn the four types of problems and explore the process of lean problem solving to overcome obstacles and improve work processes.
Use the 8D method of problem-solving to discover the root causes of an issue and implement necessary systematic changes. Download our template to start.
Guide: 8D Problem Solving - Learn Lean Sigma. 8D Problem Solving is a systematic and structured approach used to solve business related problems. It names has been given by the fact there are 8 steps or 8 disciplines that are followed to identify, correct and eliminate recurring problems. 8D Problem Solving is regarded as robust methodology ...
Mike Sullivan Principal Operations & Process Improvement Point B Table of Contents • 6 Step Problem Solving Overview and the Benefits of Using the A3 as a guide • Overview of the 6 Step Guide to Problem Solving using the A3 (with Example) • Practical example using the 6 Step Problem Solving process • Questions 2 3
Find downloadable forms and templates here for A3 problem solving, standard work, project management, and value stream mapping.
Here, we report a modular multicellular system created by mixing and matching discrete engineered bacterial cells. This system can be designed to solve multiple computational decision problems.
Problem-solving stands as a fundamental skill, crucial in navigating the complexities of both everyday life and professional environments. Far from merely providing quick fixes, it entails a comprehensive process involving the identification, analysis, and resolution of issues. This multifaceted approach requires an understanding of the problem's nature, the exploration of its various ...
3. An Example Problem Solving A3. How important is the A3 template vs. the thinking behind the template? Look at the Problem Solving Flowchart. 8 Step Problem Solving. Problem Solving Flow Chart. Step 1: Framing the Problem. Theme. Step 2: Narrowing Down the Problem Step 3: Target Setting.